HOT TOPICS LIST
- MACD
- Fibonacci
- RSI
- Gann
- ADXR
- Stochastics
- Volume
- Triangles
- Futures
- Cycles
- Volatility
- ZIGZAG
- MESA
- Retracement
- Aroon
INDICATORS LIST
LIST OF TOPICS
PRINT THIS ARTICLE
by Koos van der Merwe
Many experts refer to a dead cat bounce after the market falls dramatically. How does this apply to the current market?
Position: Buy
Koos van der Merwe
Has been a technical analyst since 1969, and has worked as a futures and options trader with First Financial Futures in Johannesburg, South Africa.
PRINT THIS ARTICLE
ELLIOTT WAVE
That Dead Cat Bounce
04/11/14 05:34:48 PMby Koos van der Merwe
Many experts refer to a dead cat bounce after the market falls dramatically. How does this apply to the current market?
Position: Buy
| A dead cat bounce is a correction upward after the market falls dramatically, without any fundamental reason to explain the upward move. As an Elliotician, I have always looked at a dead cat bounce as a B-Wave correction upward after an A-Wave fall. However, B-Waves are always difficult to forecast, with many B-Waves leading to a Wave 1 upward move with a Wave 2 correction that can be anything, occasionally falling somewhere between 72% - 100% of Wave 1. This is decided only when Wave 2 does not fall below the Wave A bottom. With many presently warning investors to beware of a dead cat bounce after the recent market correction, what do the charts tell us? |

|
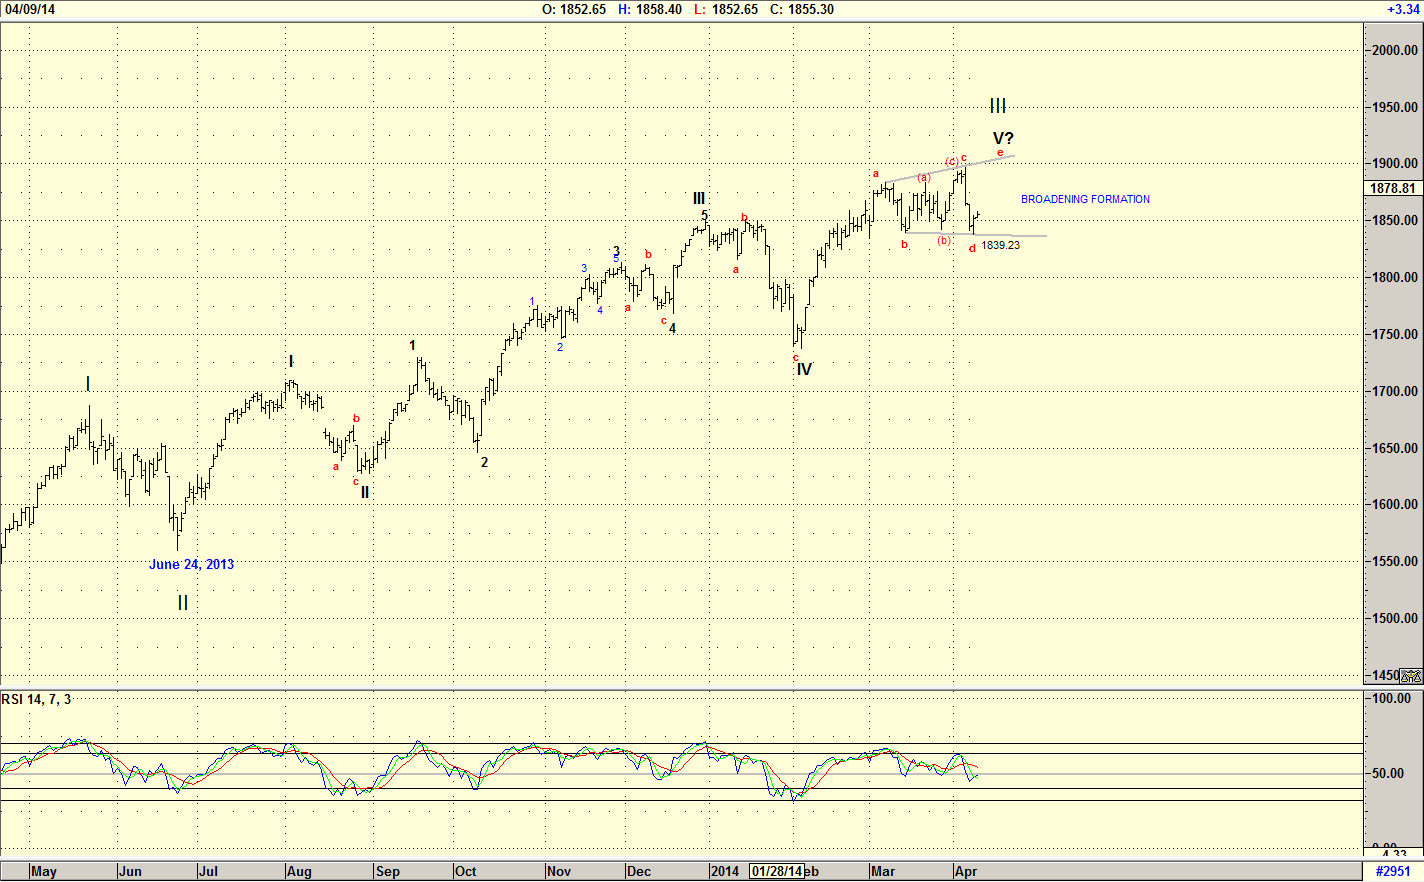
| Figure 1. An Elliott Wave count of the S&P500 Index. |
| Graphic provided by: AdvancedGET. |
| |
| The chart in Figure 1 is a daily chart of the S&P500 Index with an Elliott Wave count suggesting that the index could be completing a Wave V of a major WAVE III. The uncertainty is the broadening formation that has formed. A broadening formation suggests uncertainty. With the Ukrainian crises; with the "Sell in May" mantra; with the argument over high frequency trading and finally with many bears gathering publicity to increase sales of their newsletters, there is ample doubt as to where the market is going. The broadening formation suggests that at 1839.23 (wave d) the index has found support. The rise to 'e', the upper resistance line can be either direct, ie quick, or can be slow with an abc wave count over a number of weeks. The uncertainty of investors has to be overcome, and this can be slow as negativity in the market is overcome. Do note the RSI indicator which, when looking back over its performance, has given buy signals when it falls below the 50 horizontal line. At the moment it could be suggesting another buy signal. |

|
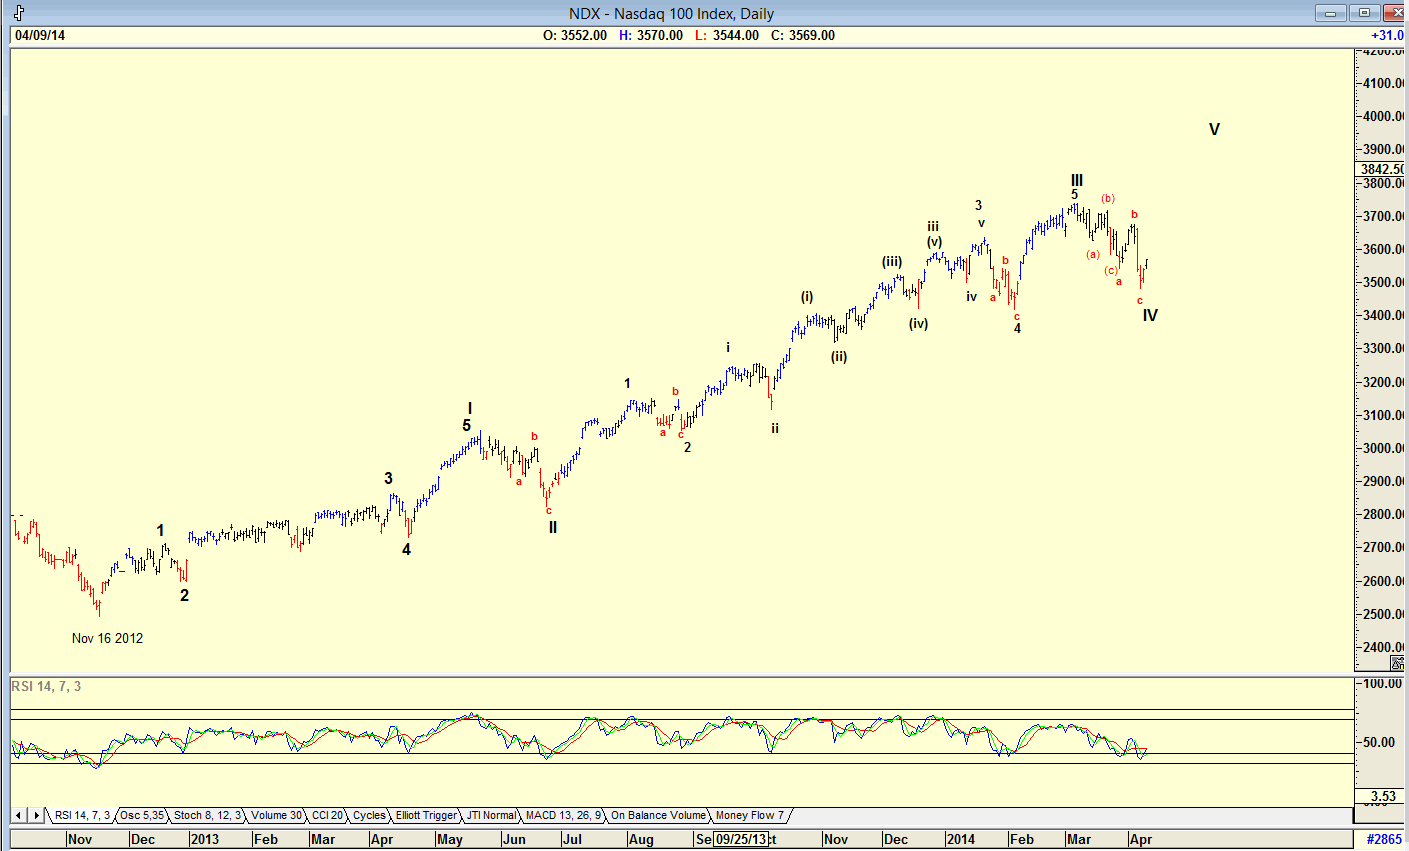
| Figure 2. An Elliott Wave count of the Nasdaq 100 Index. |
| Graphic provided by: AdvancedGET. |
| |
| The chart in Figure 2 is an Elliott Wave count of the Nasdaq 100 index from November 16th 2012. The chart is suggesting that WAVE IV is complete and that the index should now start moving upwards in a WAVE V. This is confirmed by the RSI indicator which has given a buy signal. The charts in Figure 1 and Figure 2 show that the dead cat bounce could be an Elliott Wave V upwards. However, the words "Dead Cat Bounce" do suggest a limited up move, whereas a WAVE V is a much stronger move than the Wave B correction a dead cat bounce usually signifies. Where the S&P500 index in Figure 1 suggests uncertainty, the Nasdaq index in Figure 2 does not, however that does not mean that the Wave V top will exceed the WAVE III top. Should it not rise above the WAVE III top, and then starts falling, the wave count will change to an abc correction for WAVE IV. However, I doubt this will happen. Personally, I would ignore the negativity of the dead cat bounce, but I would keep in mind the "Sell in May" mantra, looking for a WAVE V top sometime around the end of April to middle of May. |
Has been a technical analyst since 1969, and has worked as a futures and options trader with First Financial Futures in Johannesburg, South Africa.
| Address: | 3256 West 24th Ave |
| Vancouver, BC | |
| Phone # for sales: | 6042634214 |
| E-mail address: | petroosp@gmail.com |
Click here for more information about our publications!
Comments
Date: 04/17/14Rank: 5Comment:

Request Information From Our Sponsors
- StockCharts.com, Inc.
- Candle Patterns
- Candlestick Charting Explained
- Intermarket Technical Analysis
- John Murphy on Chart Analysis
- John Murphy's Chart Pattern Recognition
- John Murphy's Market Message
- MurphyExplainsMarketAnalysis-Intermarket Analysis
- MurphyExplainsMarketAnalysis-Visual Analysis
- StockCharts.com
- Technical Analysis of the Financial Markets
- The Visual Investor
- VectorVest, Inc.
- Executive Premier Workshop
- One-Day Options Course
- OptionsPro
- Retirement Income Workshop
- Sure-Fire Trading Systems (VectorVest, Inc.)
- Trading as a Business Workshop
- VectorVest 7 EOD
- VectorVest 7 RealTime/IntraDay
- VectorVest AutoTester
- VectorVest Educational Services
- VectorVest OnLine
- VectorVest Options Analyzer
- VectorVest ProGraphics v6.0
- VectorVest ProTrader 7
- VectorVest RealTime Derby Tool
- VectorVest Simulator
- VectorVest Variator
- VectorVest Watchdog
