

HOT TOPICS LIST
- MACD
- Fibonacci
- RSI
- Gann
- ADXR
- Stochastics
- Volume
- Triangles
- Futures
- Cycles
- Volatility
- ZIGZAG
- MESA
- Retracement
- Aroon
INDICATORS LIST
LIST OF TOPICS
PRINT THIS ARTICLE
by Donald W. Pendergast, Jr.
Truly an epic market performer during 2012/2013, shares of Helmerich & Payne may be nearing the end of a proportional pullback to support.
Position: N/A
Donald W. Pendergast, Jr.
Freelance financial markets writer and online publisher of the Trendzetterz.com S&P 500 Weekly Forecast service.
PRINT THIS ARTICLE
SUPPORT & RESISTANCE
HP: Expecting A Bounce From Support
04/11/14 11:44:27 AMby Donald W. Pendergast, Jr.
Truly an epic market performer during 2012/2013, shares of Helmerich & Payne may be nearing the end of a proportional pullback to support.
Position: N/A
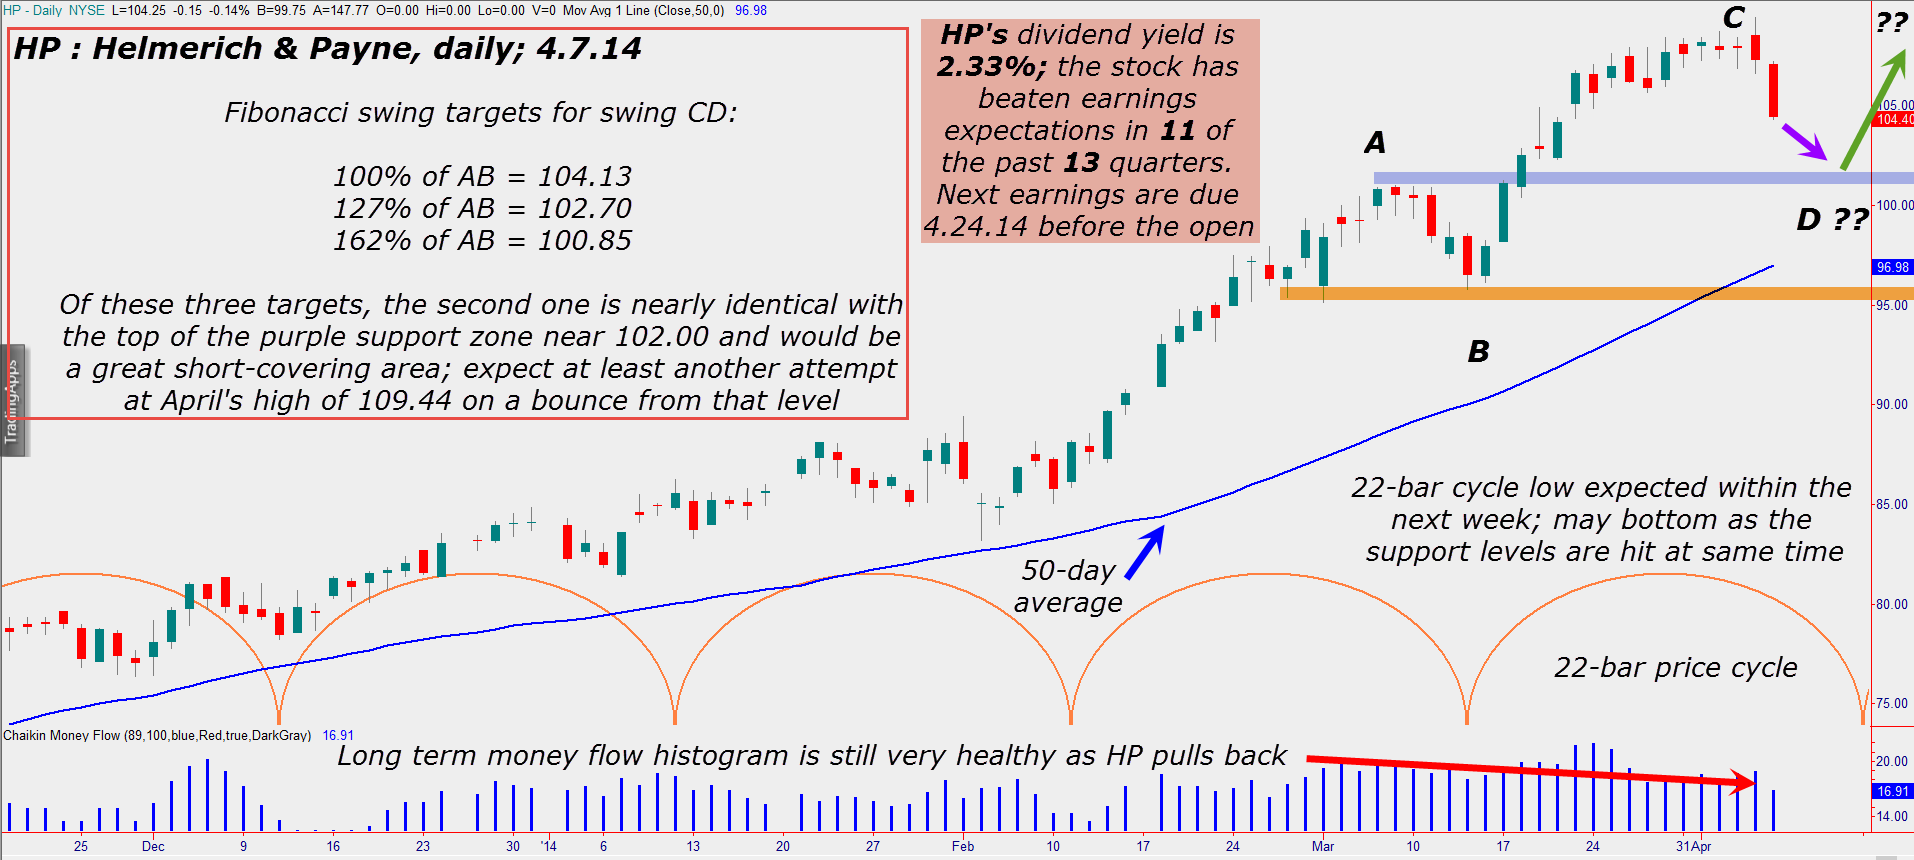
| Among energy sector stocks, few have turned in a better performance than Helmerich & Payne (HP) since the summer of 2012. From a low of 38.71 on June 29, 2012 the stock ramped all the way up to 109.44 by early April 2014, which is a gain of better than 160% in barely 21 months. Now in a proportional pullback, there appears to me several strong support levels that could easily help provide a base from which this energy player could make another attempt at another all-time high. Here's a closer look. |
|
| Figure 1. Helmerich & Payne's (HP) current mix of money flow, leading technical indicators and price cycles strongly suggests that the stock will soon find support and make another attempt at a record high soon. |
| Graphic provided by: TradeStation. |
| |
| Although we will focus on the near-term swing trading setup on HP's daily chart (Figure 1), it's also a good idea to be aware of the bigger picture that the stock's monthly chart affords us, too. 1. HP is already in a monthly parabolic ascent; most previous monthly parabolic rises ended badly, with huge declines witnessed in the stock in following months. 2. The 89-month money flow histogram confirms that major distribution has been underway for many months. 3. The 20-month price cycle is in a major topping zone. Okay; that's just a basic "heads up" to anyone who was fortunate to buy HP from lower price levels and who wishes to take some precautions to help preserve such open gains by scaling out of the position or buy purchasing put options. Daily chart-based swing traders, however, can focus on a much narrower time window of opportunity, and its daily graph and strong fundamentals are now suggesting two things: 1. HP should easily find a fresh round of buyers on any further decline toward the 101.50/102.50 area (purple shaded zone). 2. If the stock does catch a strong bid there, it has a good chance of making a solid run higher in an attempt to meet/exceed the all-time high of 109.44. The reasoning here is simple; the decline from 109.44 hasn't been of the "panic" variety but is looking orderly. Once the next key support is hit, look for the bulls to pile in for another shot at a new record high, as the long-term money flow [89-bar Chaikin Money flow (CMF)(89)] is still well above its zero line (which indicates a lack of "smart money" selling on this time frame, at least for now). Two powerful leading indicators are also in general agreement that the 102.00 area will be a strong reversal zone in which to expect another rally: 1. Swing CD will equal 127% of swing AB near the 102.70 area. 2. HP's 22-day price cycle is expected to bottom out within the next week. Put it all together, and there is an 80-90% probability that HP will stop declining somewhere near 102.00 within the next six to 12 trading sessions, after which another attempt at a new all-time high will be made. HP's earnings history is stellar, with the stock beating earnings estimates in 11 of the last 13 quarters (in fact, it has also beaten earnings estimates for seven straight quarters); the next earnings release is set for the premarket on April 24, 2014, and that could also be a powerful catalyst to set off a new move to record highs — or to trigger a major sell signal if there is a miss for some reason. |
|
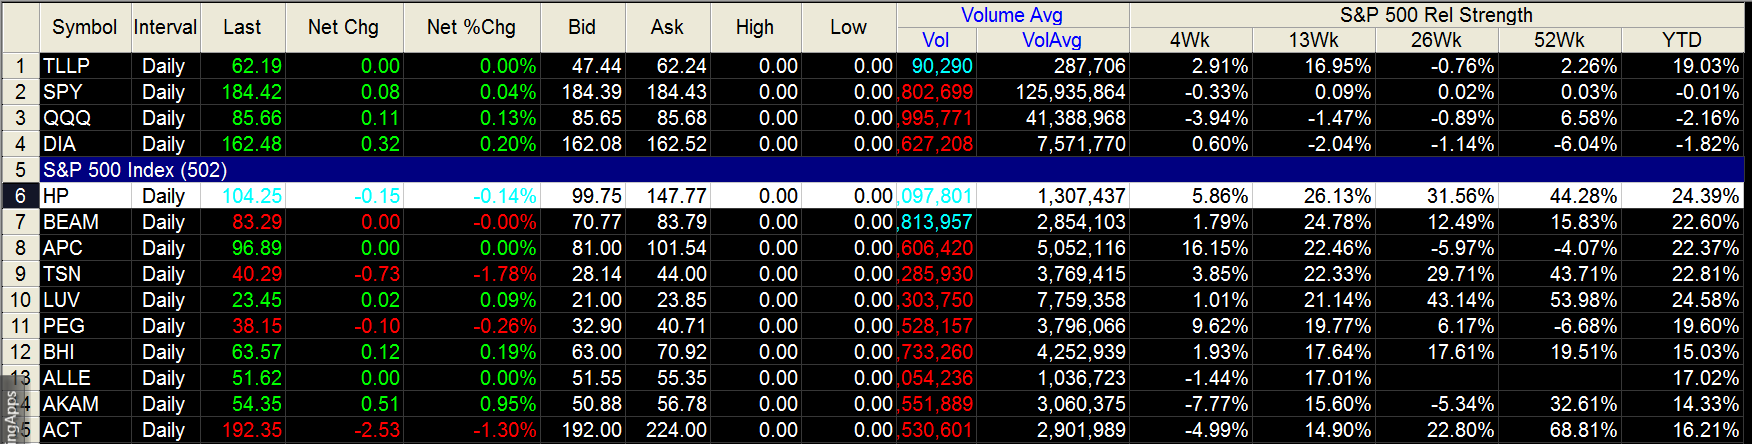
| Figure 2. HP is one of the best-performing stocks in the S&P 500 index (.SPX) over the past year. |
| Graphic provided by: TradeStation. |
| Graphic provided by: TradeStation Radar Screen. |
| |
| So, the bottom line for HP might thus be summarized as follows: 1. Look for the bulls to step in somewhere around 102.00 and for HP to make at least one final try at another record high. 2. If the rally fails to meet 109.44, then be prepared to see the start of a larger-scale correction. 3. Existing long-term holders of HP should be protective of their positions or might even want to begin scaling out aggressively. 4. Once HP's monthly parabolic move exhausts and begins a violent turn lower, expect a flood of selling pressure that will wipe out most, if not all of the stock's gains, since early 2013. This could be an "epic" short sale for savvy traders, once the anticipated monthly reversal gains steam. Trade wisely until we meet here again. |
Freelance financial markets writer and online publisher of the Trendzetterz.com S&P 500 Weekly Forecast service.
| Title: | Market consultant and writer |
| Company: | Trendzetterz |
| Address: | 81 Hickory Hollow Drive |
| Crossville, TN 38555 | |
| Phone # for sales: | 904-303-4814 |
| Website: | trendzetterz.com |
| E-mail address: | support@trendzetterz.com |
Traders' Resource Links | |
| Trendzetterz has not added any product or service information to TRADERS' RESOURCE. | |
Click here for more information about our publications!
Comments

Request Information From Our Sponsors
- StockCharts.com, Inc.
- Candle Patterns
- Candlestick Charting Explained
- Intermarket Technical Analysis
- John Murphy on Chart Analysis
- John Murphy's Chart Pattern Recognition
- John Murphy's Market Message
- MurphyExplainsMarketAnalysis-Intermarket Analysis
- MurphyExplainsMarketAnalysis-Visual Analysis
- StockCharts.com
- Technical Analysis of the Financial Markets
- The Visual Investor
- VectorVest, Inc.
- Executive Premier Workshop
- One-Day Options Course
- OptionsPro
- Retirement Income Workshop
- Sure-Fire Trading Systems (VectorVest, Inc.)
- Trading as a Business Workshop
- VectorVest 7 EOD
- VectorVest 7 RealTime/IntraDay
- VectorVest AutoTester
- VectorVest Educational Services
- VectorVest OnLine
- VectorVest Options Analyzer
- VectorVest ProGraphics v6.0
- VectorVest ProTrader 7
- VectorVest RealTime Derby Tool
- VectorVest Simulator
- VectorVest Variator
- VectorVest Watchdog