HOT TOPICS LIST
- MACD
- Fibonacci
- RSI
- Gann
- ADXR
- Stochastics
- Volume
- Triangles
- Futures
- Cycles
- Volatility
- ZIGZAG
- MESA
- Retracement
- Aroon
INDICATORS LIST
LIST OF TOPICS
PRINT THIS ARTICLE
by Koos van der Merwe
On April 4, 2014 Canoe EIT Income Fund announced a warrant offering.
Position: Hold
Koos van der Merwe
Has been a technical analyst since 1969, and has worked as a futures and options trader with First Financial Futures in Johannesburg, South Africa.
PRINT THIS ARTICLE
THE FALLING WEDGE
Canoe Income Fund
04/11/14 11:33:17 AMby Koos van der Merwe
On April 4, 2014 Canoe EIT Income Fund announced a warrant offering.
Position: Hold
| Subject to the fund obtaining necessary regulatory and TSX approval, unitholders will receive warrants on the basis of one warrant for each whole unit held on record date. Canoe Income Fund is one of Canada's largest diversified closed-end investment funds listed on the TSX. The fund is designed to maximize distributions and net asset value for the benefit of its shareholders. The company is one of Canada's fastest growing mutual fund companies and as of March 31, 2014 manages approximately $2.3 billion in assets through its investment products. At its current price of $12.25, the yield on dividends paid is 9.99%. |

|
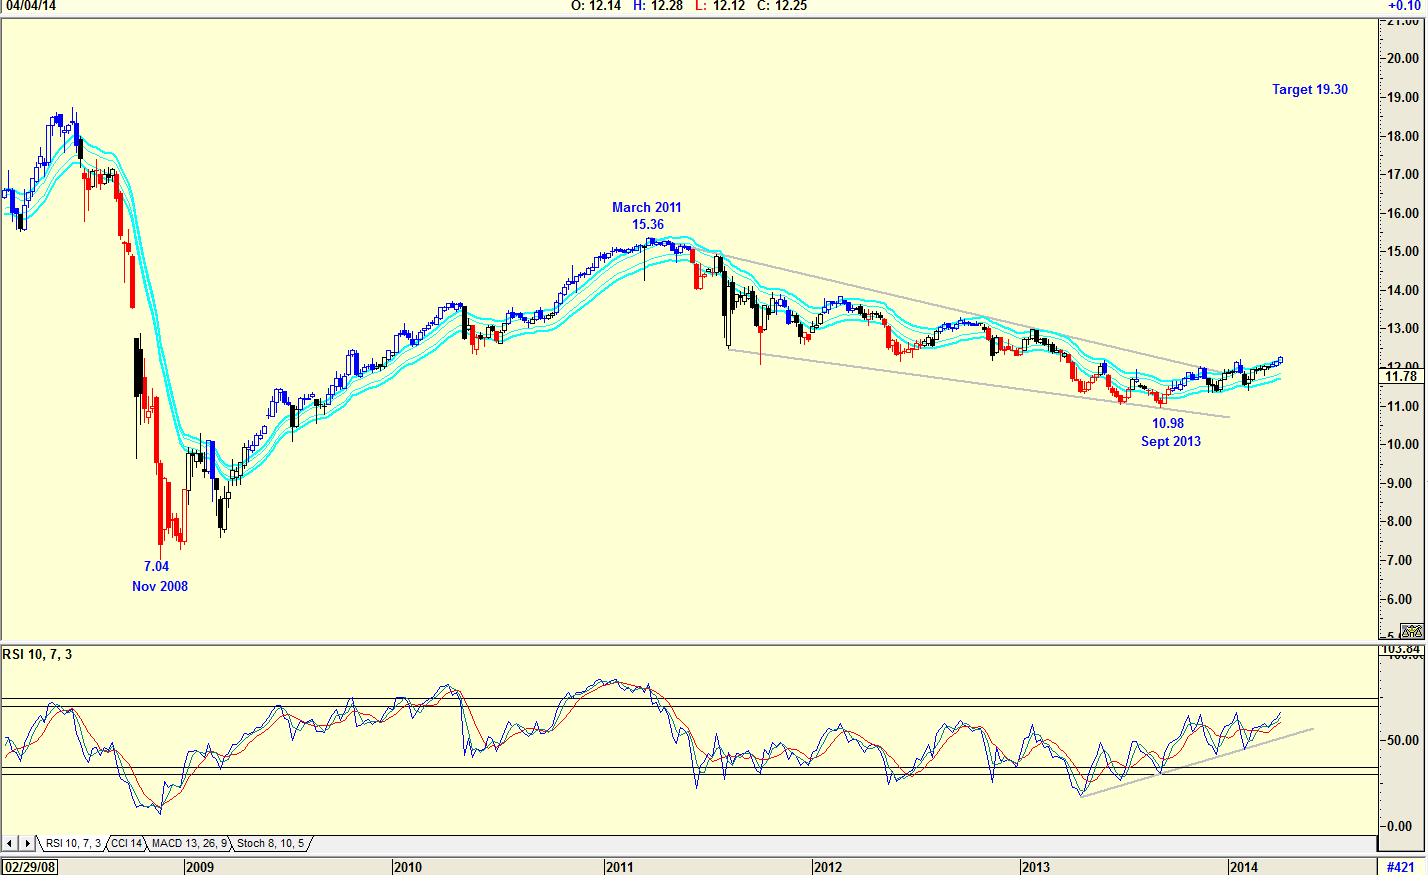
| Figure 1. Weekly chart showing a falling wedge. |
| Graphic provided by: AdvancedGET. |
| |
| The chart in Figure 1 is a weekly chart showing a large falling wedge. In a falling wedge both boundary lines slant down from right to left but the upper line descends at a steeper angle than the lower line. When prices move out of a falling wedge, they are apt to drift sidewise and "saucer-out" before beginning to rise. The target suggested by the falling wedge is $19.30 (15.36-7.04=8.32+10.98=19.30). With an RSI trending upward, the target of $19.30 is possible. |

|
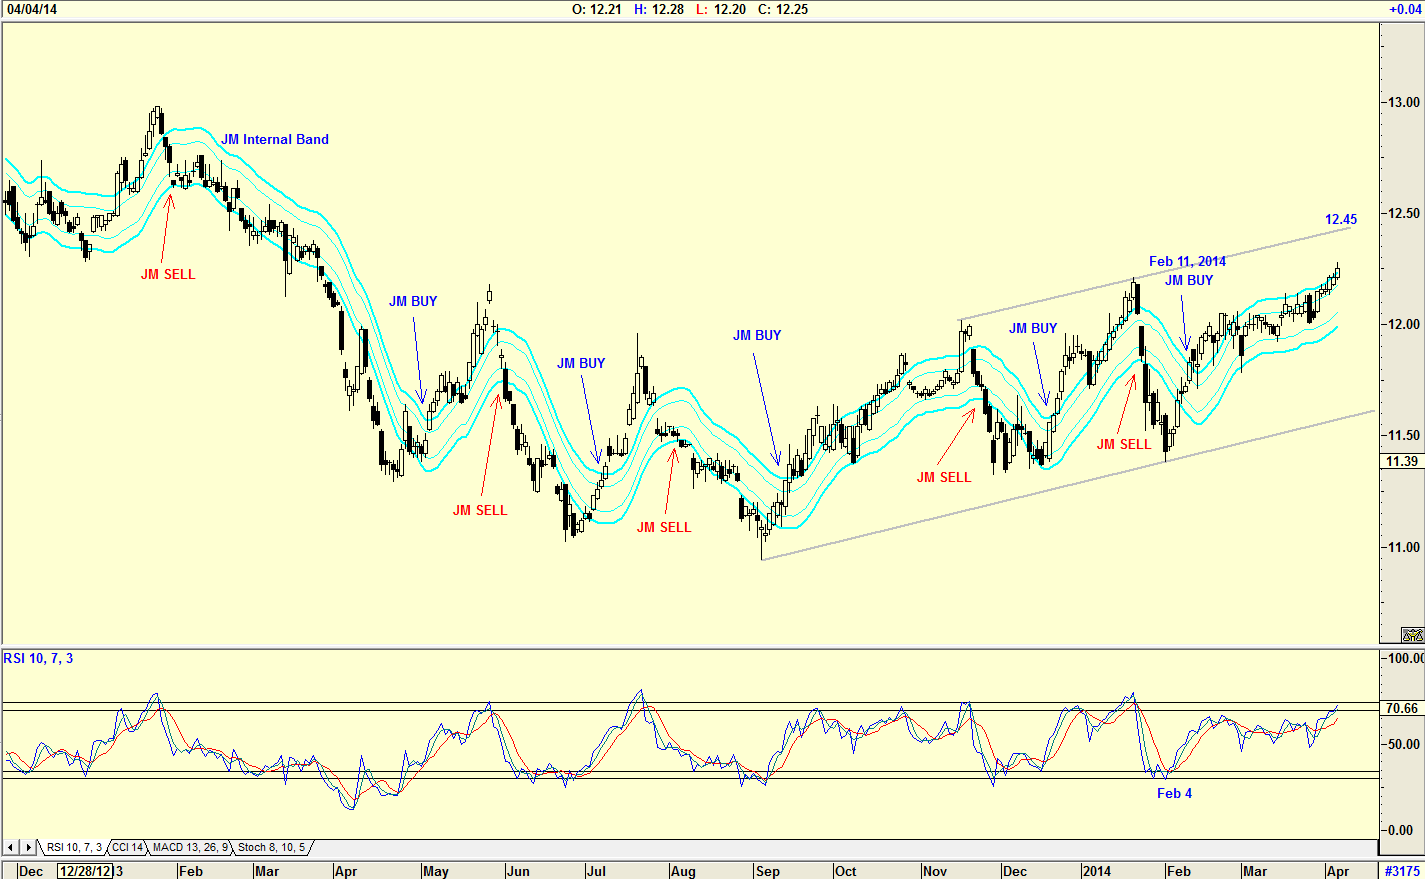
| Figure 2. Daily chart with JM internal band. |
| Graphic provided by: AdvancedGET. |
| |
| The chart in Figure 1 is a daily chart with a JM Internal Band that gave a buy signal on February 11, 2014. The JM Internal Band is a 15-period simple moving average (SMA) offset by 2% positive and 2% negative. The RSI indicator gave a buy signal on February 4, 2014 and the share price rose strongly. The RSI indicator is approaching overbought levels, with the upper resistance trendline target in the region of $12.45. With the weekly chart in Figure 1 suggesting a target of $19.30, with a dividend being paid offering a yield of 9.99% at a share price of $12.25, and with the daily chart in Figure 2 suggesting a correction in the near future as the RSI is at overbought levels, buying the share on a correction becomes an attractive play. |
Has been a technical analyst since 1969, and has worked as a futures and options trader with First Financial Futures in Johannesburg, South Africa.
| Address: | 3256 West 24th Ave |
| Vancouver, BC | |
| Phone # for sales: | 6042634214 |
| E-mail address: | petroosp@gmail.com |
Click here for more information about our publications!
PRINT THIS ARTICLE

|

Request Information From Our Sponsors
- StockCharts.com, Inc.
- Candle Patterns
- Candlestick Charting Explained
- Intermarket Technical Analysis
- John Murphy on Chart Analysis
- John Murphy's Chart Pattern Recognition
- John Murphy's Market Message
- MurphyExplainsMarketAnalysis-Intermarket Analysis
- MurphyExplainsMarketAnalysis-Visual Analysis
- StockCharts.com
- Technical Analysis of the Financial Markets
- The Visual Investor
- VectorVest, Inc.
- Executive Premier Workshop
- One-Day Options Course
- OptionsPro
- Retirement Income Workshop
- Sure-Fire Trading Systems (VectorVest, Inc.)
- Trading as a Business Workshop
- VectorVest 7 EOD
- VectorVest 7 RealTime/IntraDay
- VectorVest AutoTester
- VectorVest Educational Services
- VectorVest OnLine
- VectorVest Options Analyzer
- VectorVest ProGraphics v6.0
- VectorVest ProTrader 7
- VectorVest RealTime Derby Tool
- VectorVest Simulator
- VectorVest Variator
- VectorVest Watchdog
