

HOT TOPICS LIST
- MACD
- Fibonacci
- RSI
- Gann
- ADXR
- Stochastics
- Volume
- Triangles
- Futures
- Cycles
- Volatility
- ZIGZAG
- MESA
- Retracement
- Aroon
INDICATORS LIST
LIST OF TOPICS
PRINT THIS ARTICLE
by Donald W. Pendergast, Jr.
The transition from bull to bear market can take time, but is observable to a skilled technician.
Position: N/A
Donald W. Pendergast, Jr.
Freelance financial markets writer and online publisher of the Trendzetterz.com S&P 500 Weekly Forecast service.
PRINT THIS ARTICLE
CHART ANALYSIS
Citigroup: Bearish Continuation Move Probable?
04/09/14 04:58:31 PMby Donald W. Pendergast, Jr.
The transition from bull to bear market can take time, but is observable to a skilled technician.
Position: N/A
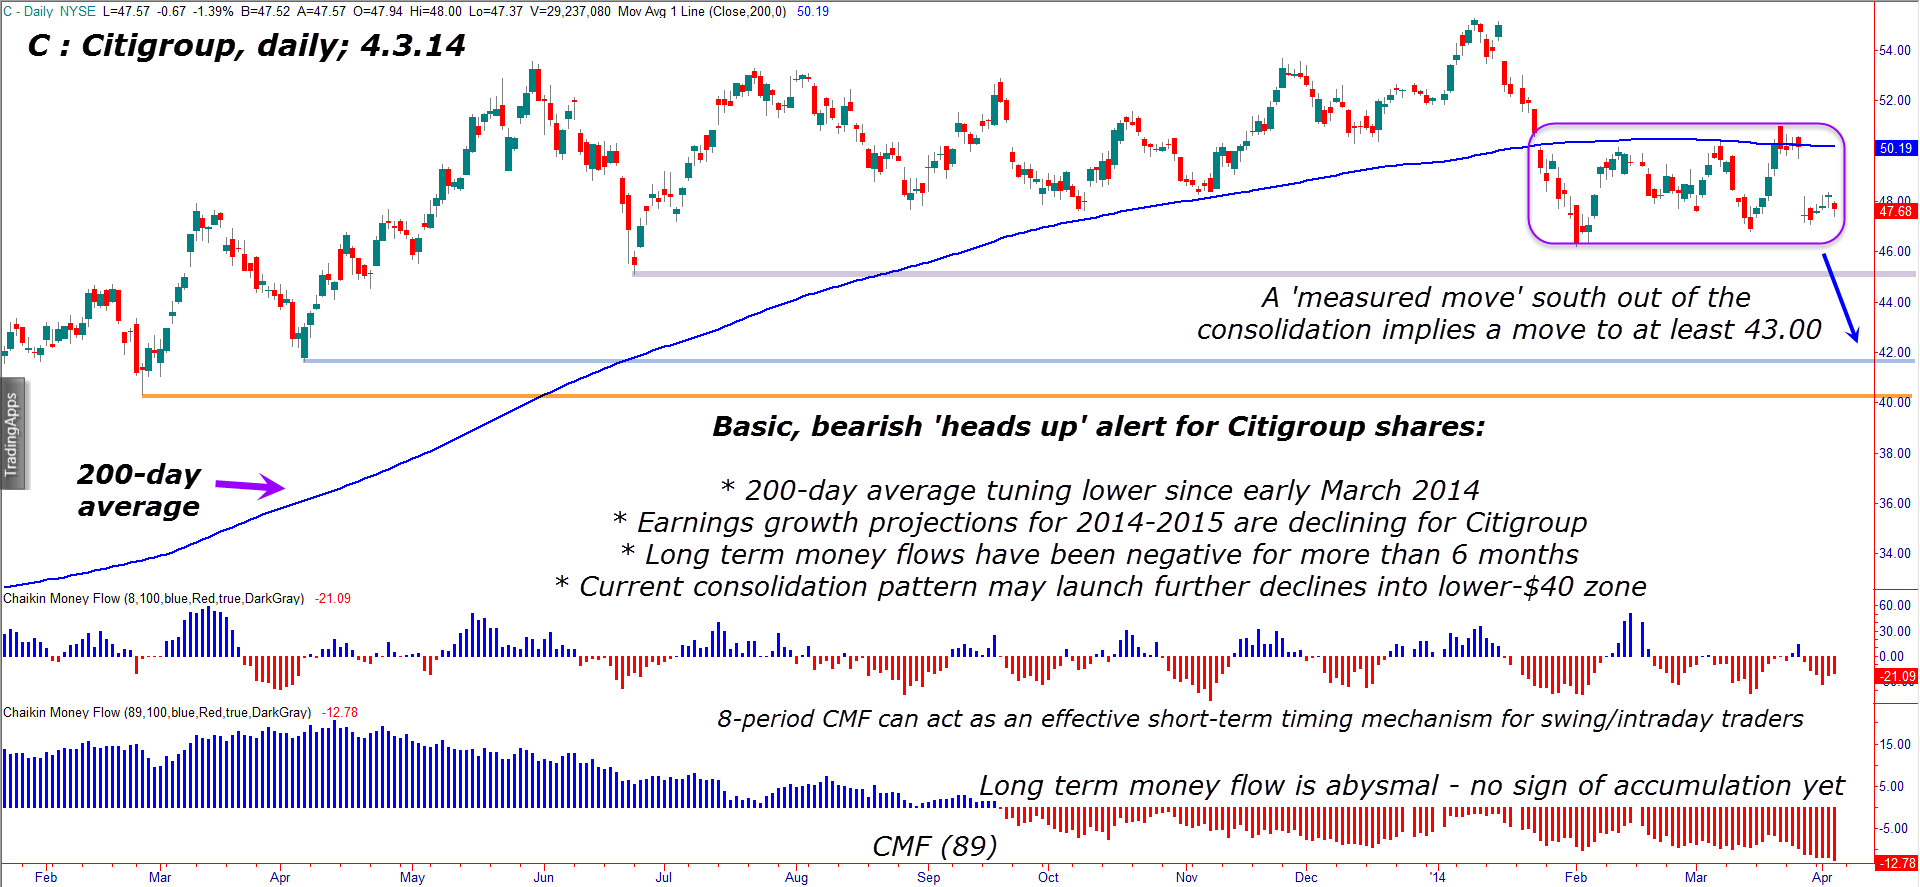
| Still enmeshed in a major bear market, shares of Citigroup (C) may finally have made their final highs of their 2009-2014 relief rally. If you've been trading or investing for any length of time you know that at the end of 2006 the stock was trading at 570.00 — just before it entered a massive decline that saw it shed 95% of its value by March 2009. If you doubt this, just pull up a monthly chart for C and stare in wonder and awe at the power of a vicious, financial-panic induced rout. Today, C trades at a price that is still a small fraction of its 2000/2006 highs (still less than a tenth of what is was worth at those previous highs) and now appears to be setting up for a possible measured move to the downside. Here's a closer look. |
|
| Figure 1. Citigroup's (C) trend reversal has been gradual but may now be approaching a major inflection point if it breaks down hard from the 11-week consolidation pattern. |
| Graphic provided by: TradeStation. |
| |
| Investors were in a state of shock as the 2007-2009 financial crisis went from bad, then to worse then to "stop the planet, I want to get off it." Truly, as the crisis worsened after the collapse of Lehman Brothers (September 2008), no one had a clue if/when/how the entire mess was ever going to get cleaned up, and that's one of the reasons C was sold off to such an extraordinary degree. And even though rational thinking clearly suggested that the stock was a screaming buy at 9.70 per share in March 2009, few, if any, retail investors were willing to step up and buy large amounts of shares. But for those with courage and strong confidence in America's ability to recover, buying in, at, or near the 2009 lows was perhaps a once in a lifetime chance to get setup for major, enduring multi-year gains. Well, C did recover, going on to hit the mid-$50 area by March 2014, handing patient investors a nice capital gain. But hopefully their patience is ending now, given the high-probability trend reversal setup on Citi's daily (and weekly) chart. 1. Earnings growth rate projections for 2014/2015 are declining. 2. The 200-day moving average (SMA) has finally begun to curve lower for the first time since July 2011. 3. The current rectangle (consolidation) pattern on Citi's daily chart (Figure 1) may eventually play out to be a Launchpad for a bearish continuation pattern; the nominal target price zone for such a move south is down toward the 43.00 to 44.00 area. There are several other key support lines on the chart, too, those being at the 45.00, 42.00, and 40.00 price levels. Taken as a whole, the technical/fundamental scenario for Citi is decidedly bearish for at least the next three to six months, although there might still be tradable bounces after a probable breakdown from the rectangle pattern. |
|
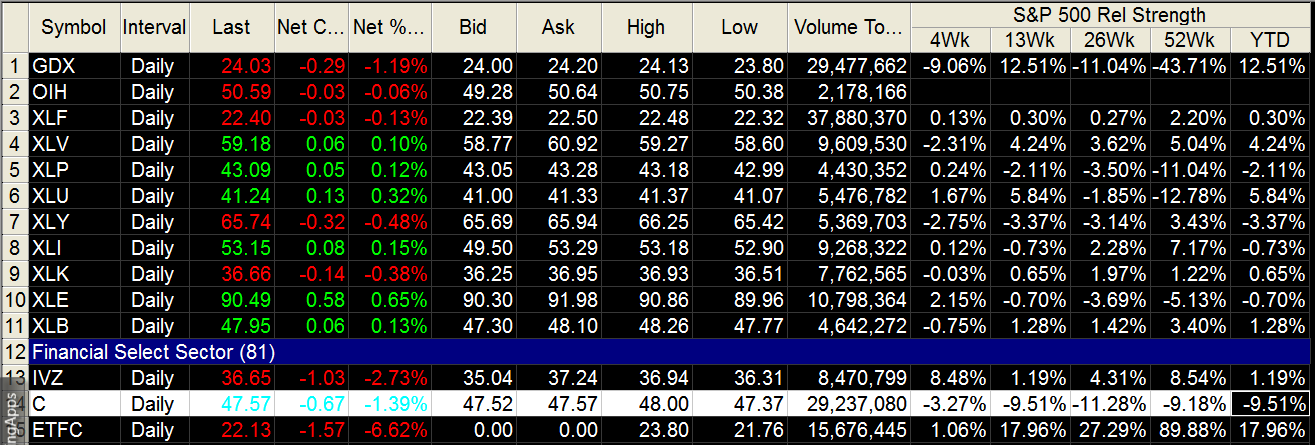
| Figure 2. Citigroup has been underperforming the S&P 500 index (.SPX) across numerous holding periods. |
| Graphic provided by: TradeStation. |
| Graphic provided by: TradeStation Radar Screen. |
| |
| You'll need some sort of a timing model to help you get in on a breakdown move here; the 'Swing Trading with Three Indicators' article in TASC (which was tested on this same stock) might be a good starting point as you evaluate various methods for entering/exiting stocks with a reliable history of making sustained swing moves. Whichever method you use, keep your account risk at 1 to 2% and remember to trade wisely until we meet here again. |
Freelance financial markets writer and online publisher of the Trendzetterz.com S&P 500 Weekly Forecast service.
| Title: | Market consultant and writer |
| Company: | Trendzetterz |
| Address: | 81 Hickory Hollow Drive |
| Crossville, TN 38555 | |
| Phone # for sales: | 904-303-4814 |
| Website: | trendzetterz.com |
| E-mail address: | support@trendzetterz.com |
Traders' Resource Links | |
| Trendzetterz has not added any product or service information to TRADERS' RESOURCE. | |
Click here for more information about our publications!
Comments
Date:�04/12/14Rank:�3Comment:�

Request Information From Our Sponsors
- StockCharts.com, Inc.
- Candle Patterns
- Candlestick Charting Explained
- Intermarket Technical Analysis
- John Murphy on Chart Analysis
- John Murphy's Chart Pattern Recognition
- John Murphy's Market Message
- MurphyExplainsMarketAnalysis-Intermarket Analysis
- MurphyExplainsMarketAnalysis-Visual Analysis
- StockCharts.com
- Technical Analysis of the Financial Markets
- The Visual Investor
- VectorVest, Inc.
- Executive Premier Workshop
- One-Day Options Course
- OptionsPro
- Retirement Income Workshop
- Sure-Fire Trading Systems (VectorVest, Inc.)
- Trading as a Business Workshop
- VectorVest 7 EOD
- VectorVest 7 RealTime/IntraDay
- VectorVest AutoTester
- VectorVest Educational Services
- VectorVest OnLine
- VectorVest Options Analyzer
- VectorVest ProGraphics v6.0
- VectorVest ProTrader 7
- VectorVest RealTime Derby Tool
- VectorVest Simulator
- VectorVest Variator
- VectorVest Watchdog