HOT TOPICS LIST
- MACD
- Fibonacci
- RSI
- Gann
- ADXR
- Stochastics
- Volume
- Triangles
- Futures
- Cycles
- Volatility
- ZIGZAG
- MESA
- Retracement
- Aroon
INDICATORS LIST
LIST OF TOPICS
PRINT THIS ARTICLE
by Koos van der Merwe
Banks in the United Kingdom, as we all know, took a big hit as the 2007 bubble burst.
Position: Accumulate
Koos van der Merwe
Has been a technical analyst since 1969, and has worked as a futures and options trader with First Financial Futures in Johannesburg, South Africa.
PRINT THIS ARTICLE
DOUBLE BOTTOMS
Is It Time To Look At UK Banks?
04/08/14 05:13:38 PMby Koos van der Merwe
Banks in the United Kingdom, as we all know, took a big hit as the 2007 bubble burst.
Position: Accumulate
| Mark Carney, former Governor of the Bank of Canada and current Governor of the Bank of England and Chairman of the G20's Financial Stability Board, made a statement on April 1st, April Fool's day. He warned financial markets to prepare themselves for the possibility of sharp adjustments in interest rates. "Although the outlook is bright, prepare for the worst." Janet Yellen, Chair of the Board of Governors of the Federal Reserve System in the US, whether intentionally or unintentionally said that she expects interest rates to start rising in six months time. She covered her "slip" in a statement on March 31, 2014 by saying the U.S. economy and job market are still far from healthy, and still require plenty of support from the central bank's low-interest-rate policy. So, is it time to move into cash or to look for bargains? If the latter, there are possibly two shares you should look at as possible buys. Neither are in the US, but they are listed as ADRs on the US stock exchange. They are Royal Bank of Scotland (RBS) and Barclays Bank (BCS). |

|
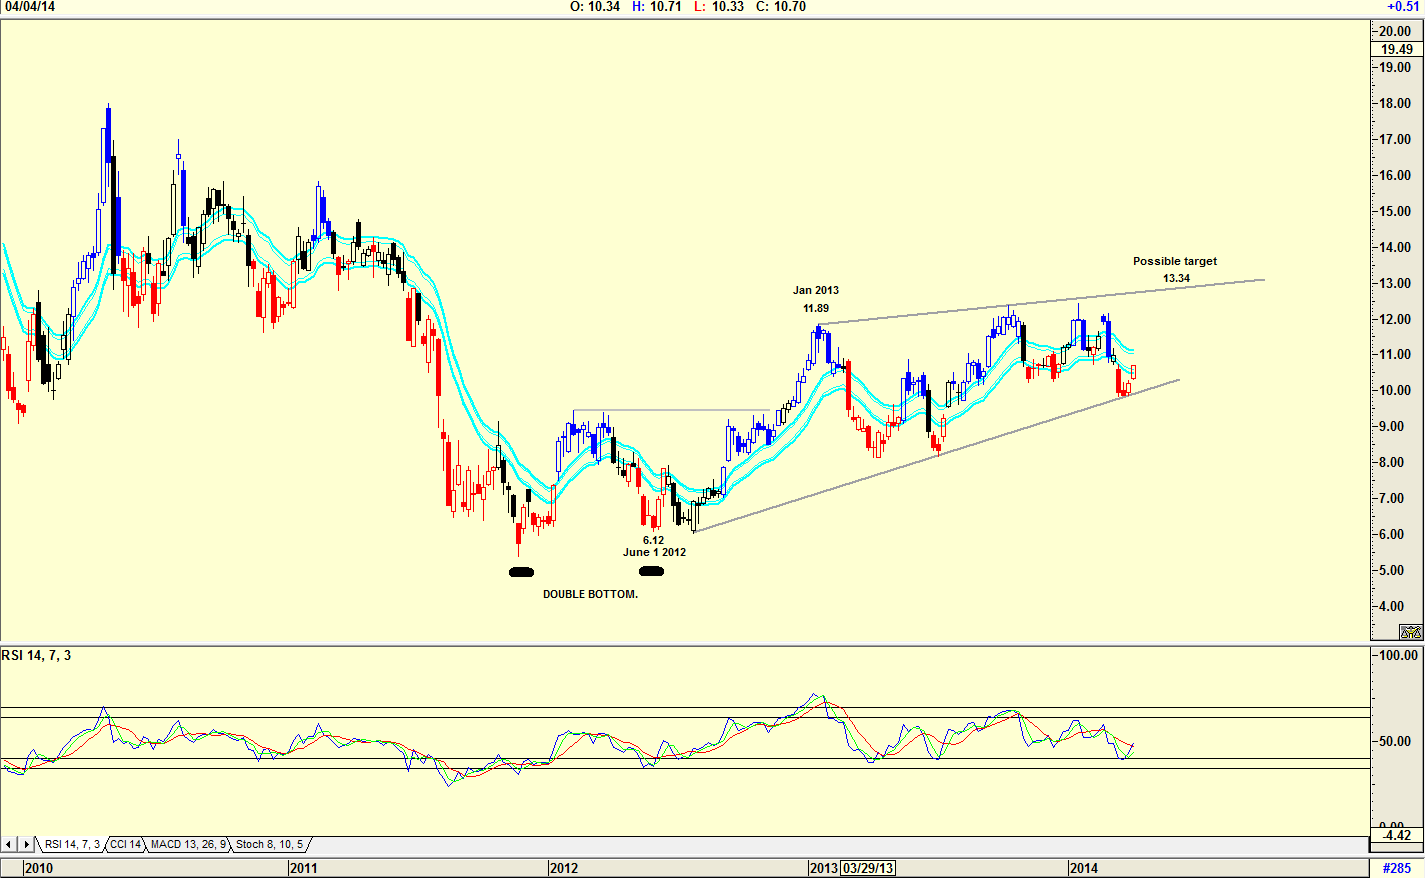
| Figure 1. Weekly chart of Royal Bank of Scotland showing double bottom. |
| Graphic provided by: AdvancedGET. |
| |
| The share price movement of a double bottom is characterised by two lows that represent buying opportunities. This is shown clearly in the weekly chart of RBS in Figure 1. The share price rose from a low of $6.12 on June 1, 2012 to a high of $11.89 by January 2013. From that level, the share price appears to be consolidating with bottoms and tops slowly rising. Note the RSI which is suggesting a possible buy with a target at the upper resistance line in the region of $13.34. |

|
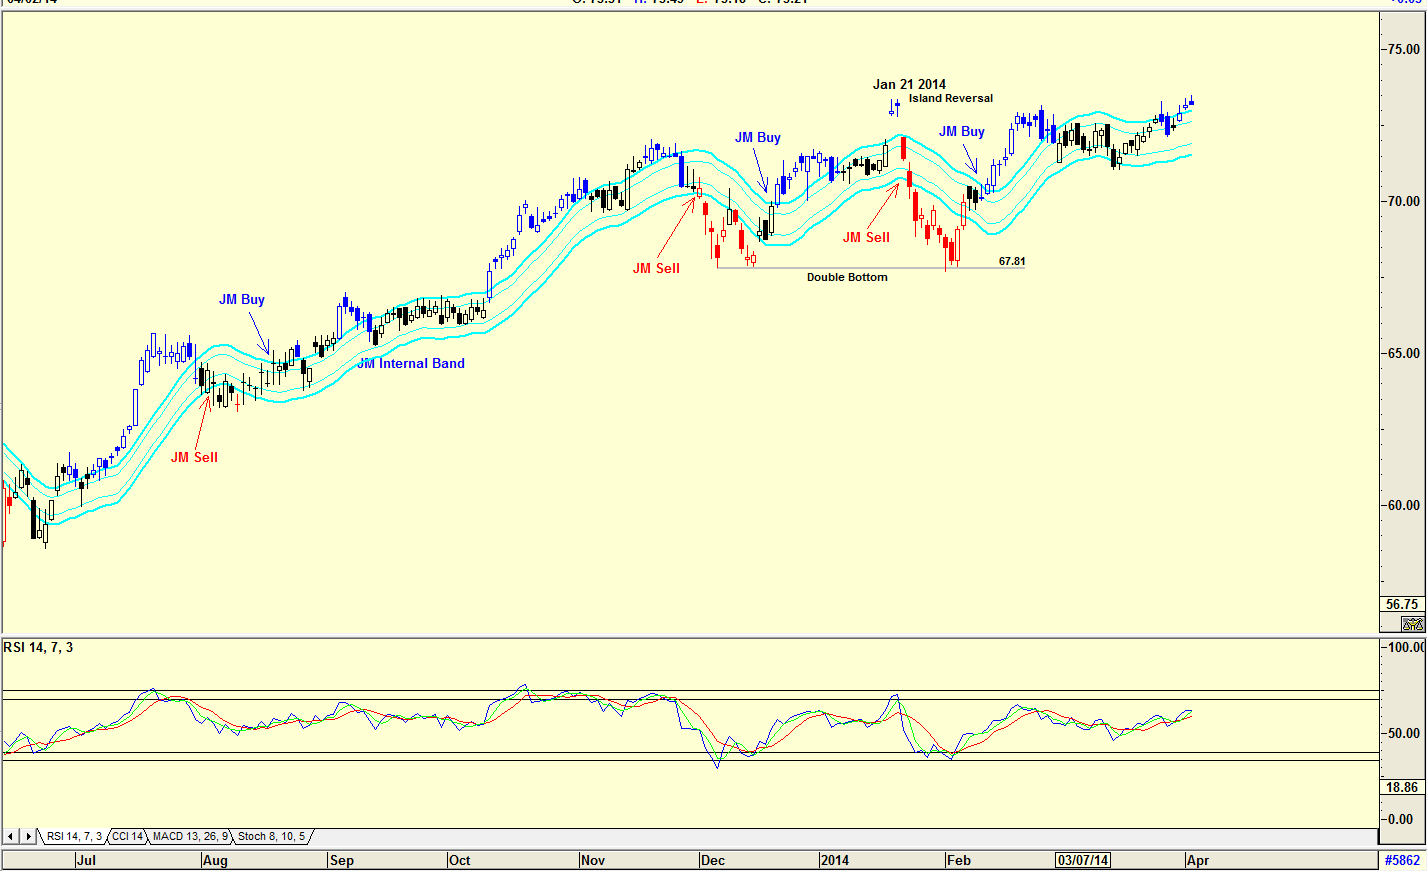
| Figure 2. Daily chart of RBS showing double bottom. |
| Graphic provided by: AdvancedGET. |
| |
| The chart in Figure 2 is a daily chart of RBS with a JM Internal Band showing buy and sell signals. A JM internal band is a 15-period simple moving average offset by 2% positive and 2% negative. Note the double bottom that formed at $67.81 suggesting strength. As a matter of interest also note the island reversal on January 21, 2014 that suggested weakness. An island reversal is when a stock price rises on a gap, and then falls on a gap. It is a significant indicator of a falling or rising price when it forms either at a top or bottom. The chart is in buy mode with the JM Internal Band indicator. The RSI indicator is also suggesting strength. |

|
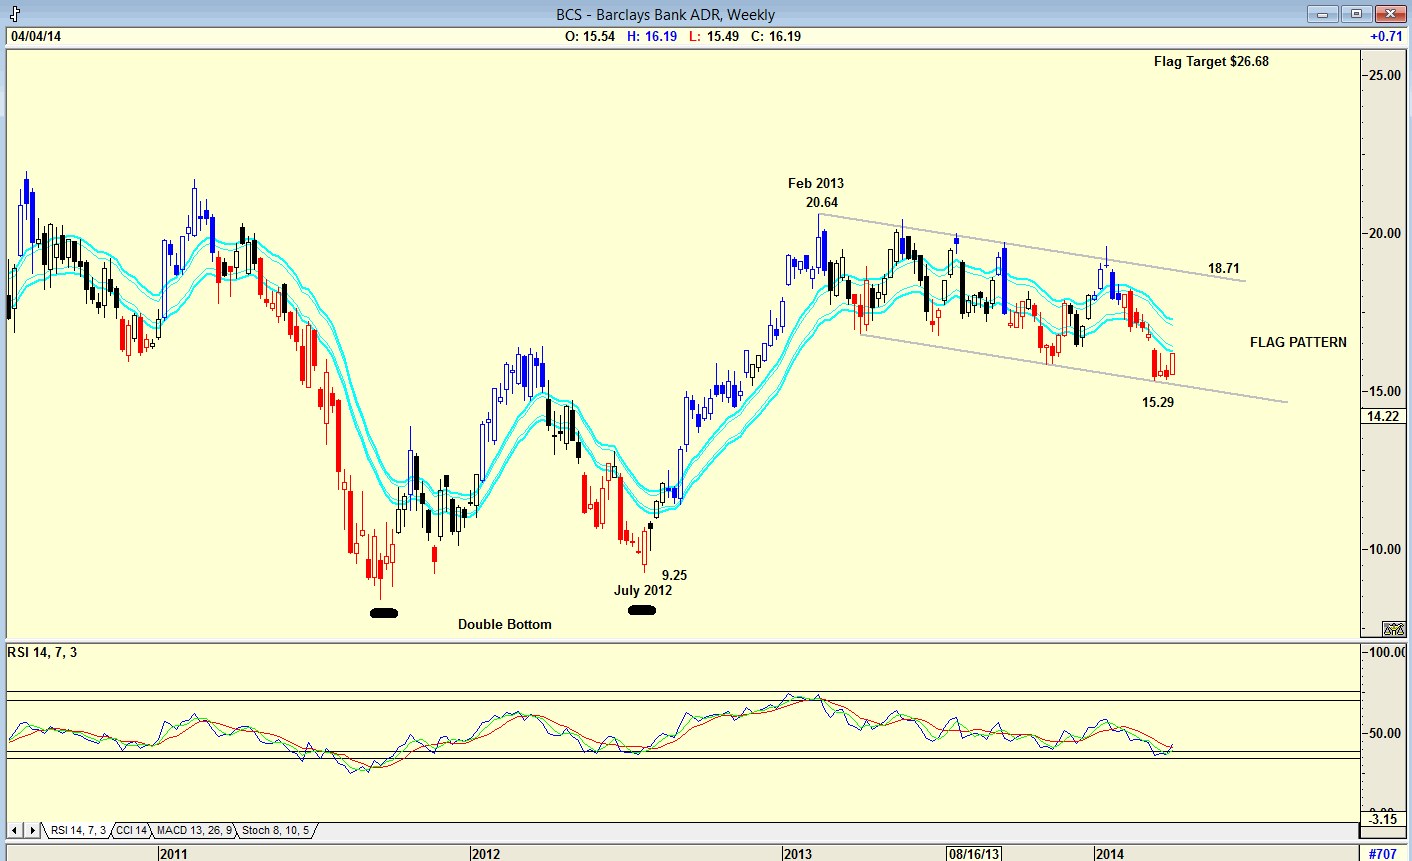
| Figure 3. Weekly chart of Barclays Bank showing double bottom and flag patterns. |
| Graphic provided by: AdvancedGET. |
| |
| The chart in Figure 3 is a weekly chart of BCS showing the double bottom and the flag pattern that have formed. A flag pattern is a consolidation pattern and a reliable indicator in terms of direction and measuring. The target for the flag pattern, should the price break above the upper resistance line in the region of $18.71, is $26.68. (20.64-9.25=11.39+15.29=26.68). Note the RSI indicator which has given a buy signal. |

|
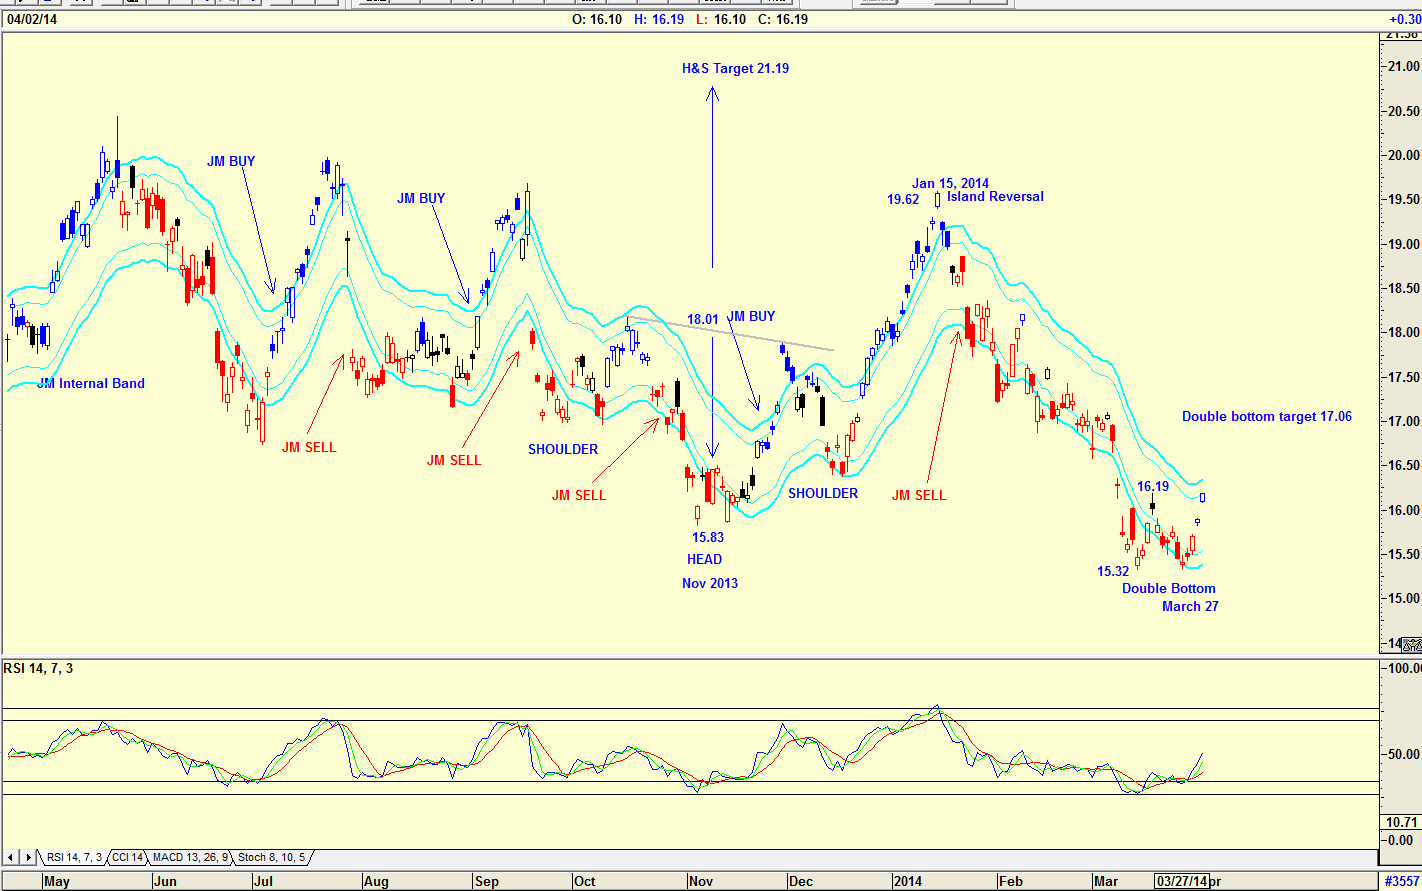
| Figure 4. Daily chart of BCS showing inverse head & shoulder and minor double bottom pattern. |
| Graphic provided by: AdvancedGET. |
| |
| The chart in Figure 4 is a daily chart of BCS. The chart shows an inverted head & shoulders pattern that developed in November 2013 suggesting a target of $21.19 (18.01-15.83=3.18+18.01=21.19). The chart also shows an island reversal in January 2014 and a double bottom at $15.32 on March 27, 2014. Note the RSI indicator gave a buy on March 27, 2014. I have calculated a double bottom target of $17.06 (16.19-15.32=0.87+16.19=17.06). A move above this target should see the price find a major resistance at the island reversal at $19.62. Should the price move above this level, then the inverse head & shoulders target is in play. Note that a JM Internal Band buy signal has as yet not been given. With the "hint" by Mark Carney and Janet Yellen that interest rates could rise before year end, investing in the US market becomes questionable. The UK economy, on the other hand, is recovering from a depression under Mark Carney, so you could seriously consider moving into UK banks. |
Has been a technical analyst since 1969, and has worked as a futures and options trader with First Financial Futures in Johannesburg, South Africa.
| Address: | 3256 West 24th Ave |
| Vancouver, BC | |
| Phone # for sales: | 6042634214 |
| E-mail address: | petroosp@gmail.com |
Click here for more information about our publications!
Comments

Request Information From Our Sponsors
- VectorVest, Inc.
- Executive Premier Workshop
- One-Day Options Course
- OptionsPro
- Retirement Income Workshop
- Sure-Fire Trading Systems (VectorVest, Inc.)
- Trading as a Business Workshop
- VectorVest 7 EOD
- VectorVest 7 RealTime/IntraDay
- VectorVest AutoTester
- VectorVest Educational Services
- VectorVest OnLine
- VectorVest Options Analyzer
- VectorVest ProGraphics v6.0
- VectorVest ProTrader 7
- VectorVest RealTime Derby Tool
- VectorVest Simulator
- VectorVest Variator
- VectorVest Watchdog
- StockCharts.com, Inc.
- Candle Patterns
- Candlestick Charting Explained
- Intermarket Technical Analysis
- John Murphy on Chart Analysis
- John Murphy's Chart Pattern Recognition
- John Murphy's Market Message
- MurphyExplainsMarketAnalysis-Intermarket Analysis
- MurphyExplainsMarketAnalysis-Visual Analysis
- StockCharts.com
- Technical Analysis of the Financial Markets
- The Visual Investor
