

HOT TOPICS LIST
- MACD
- Fibonacci
- RSI
- Gann
- ADXR
- Stochastics
- Volume
- Triangles
- Futures
- Cycles
- Volatility
- ZIGZAG
- MESA
- Retracement
- Aroon
INDICATORS LIST
LIST OF TOPICS
PRINT THIS ARTICLE
by Donald W. Pendergast, Jr.
Shares of Texas Instruments staged a major bullish breakout attempt on April 1, 2014. Can the stock follow through to new highs?
Position: N/A
Donald W. Pendergast, Jr.
Freelance financial markets writer and online publisher of the Trendzetterz.com S&P 500 Weekly Forecast service.
PRINT THIS ARTICLE
BREAKOUTS
TXN: Powerful Breakout Attempt
04/08/14 05:02:49 PMby Donald W. Pendergast, Jr.
Shares of Texas Instruments staged a major bullish breakout attempt on April 1, 2014. Can the stock follow through to new highs?
Position: N/A
| Among S&P 500 index components, Texas Instruments (TXN) shares have enjoyed a steady — but not incredible — bullish run since late 2008 (the worst part of the last major financial crisis), up about four-fold in about 5 1/2 years. Some of the best percentage gains for TXN, however, have been realized since November 2012; the shares are up 100% in a little more than 16 months. But the April Fool's Day bullish breakout attempt for TXN is sending mixed signals for this key tech sector issue and that's what we'll look at now. |
|
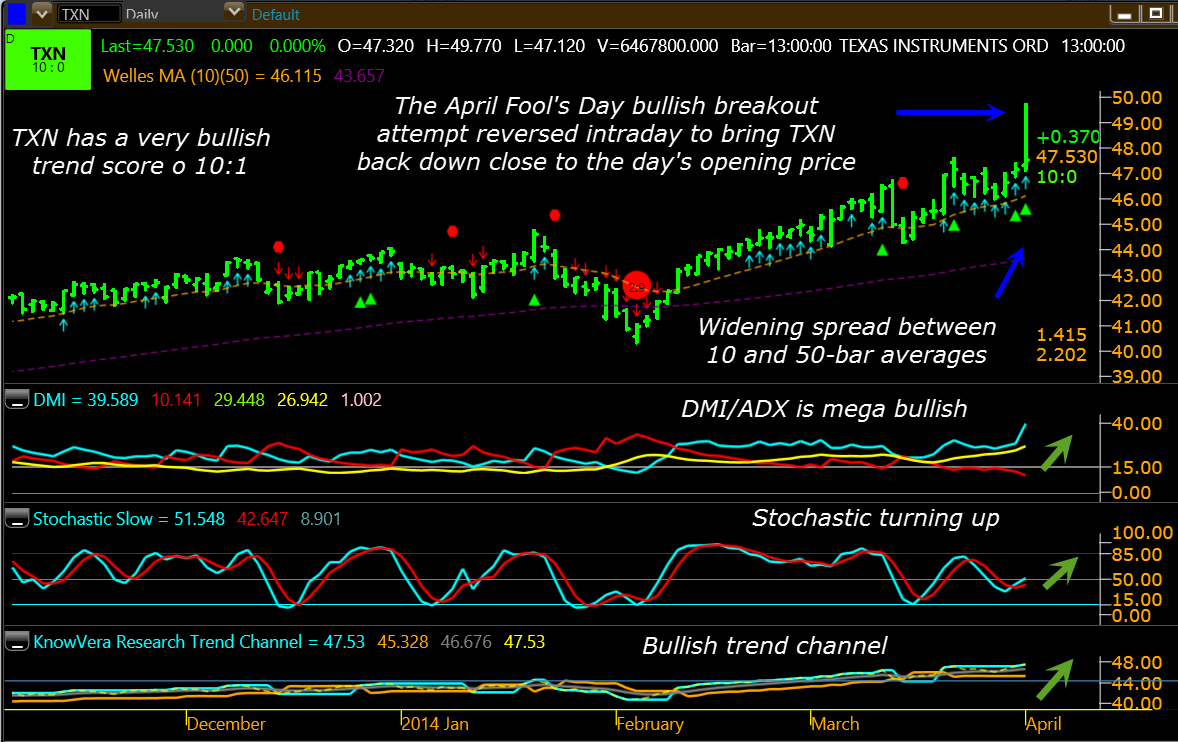
| Figure 1. Texas Instruments (TXN); all of these daily chart trend confirmation indicators are bullish, but the sharp intraday reversal after surging to new highs may be warning of a major change in trend. |
| Graphic provided by: KnowVera Research LLC. |
| |
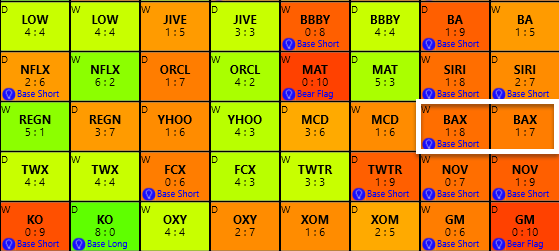
| Of all the large cap stocks tracked by the Know Vera Research platform, Texas Instruments (TXN) has the best combined daily/weekly trend scores of all on the investment screening window. The daily score is 10:1 and the weekly score is 9:1, with both time frames being ranked as a 'strong buy' by the program. Clicking on either cell brings up both charts for TXN; I'll focus on the daily chart in this article (Figure 1). Obviously, the wide-range bullish breakout attempt of Tuesday April 1, 2014 was more than enough to get the attention of traders/investors everywhere, and for all anyone knows, this stock is now poised for even greater upside surges in the weeks and months ahead. But there is cause for caution here, summarized as follows: 1. Note that TXN reversed sharply lower once it hit its intraday high of 49.77, dropping almost all the way down to its opening price of the session. 2. Since it's the market pros who account for 80% of all trading activity in US stocks, this breakout move was obviously staged by them — mere retail traders don't have that kind of buying power to move a large cap stock like that. Be advised that no technical indicator or support/resistance line means a darn thing when the smart money interests in the market decide to mark a big name stock up or down; remember that they control the market and that you had better learn how to trade alongside of them and never based solely on your indicators, systems, or algorithms. 3. Since that is true, it's also true that they are the ones who decided to drop the stock back toward its opening price; since it was the "dumb" retail trader most likely doing the buying near the top of the day's range, this could have been a "wash and rinse" kind of setup that takes place just before a major trend reversal, as the smart money ambushes the dumb money, jerking their chain, time and time again — and taking their money, too, just to add injury to insult. There really is no other explanation for this kind of bizarre price action near a multi year high, so anyone still long TXN from lower levels might want to prepare for the possibility that this stock is preparing for a proportional correction of its solid gains seen since late 2012. Remember, a stock's raw price chart will almost always look the most bullish just before the turn southward hits, and at the moment TXN hit its intraday high of 49.77, this stock's daily and intraday charts were spectacularly bullish. Then the smart money pulled the 'sell' lever and that's when the turn began. Note that all three trend confirmation indicators are still bullish, but remember that all of these are lagging and not leading indicators. |
|
| Figure 2. TXN is still outperforming the S&P 500 index (.SPX) by a modest margin over the past year. |
| Graphic provided by: TradeStation. |
| Graphic provided by: TradeStation Radar Screen. |
| |
| If you see TXN dip below 47.00 soon, assume that the big boys have decided to pull the stock lower, initiating a long-awaited ABC corrective wave pattern; consider buying slightly in-the-money put options with at least three to four months of time value remaining and see if you can profit from what looks like a classic trend reversal pattern on TXN's daily time frame. Keep your account risks at 1% maximum on any such setup and remember to trade wisely until we meet here again. |
Freelance financial markets writer and online publisher of the Trendzetterz.com S&P 500 Weekly Forecast service.
| Title: | Market consultant and writer |
| Company: | Trendzetterz |
| Address: | 81 Hickory Hollow Drive |
| Crossville, TN 38555 | |
| Phone # for sales: | 904-303-4814 |
| Website: | trendzetterz.com |
| E-mail address: | support@trendzetterz.com |
Traders' Resource Links | |
| Trendzetterz has not added any product or service information to TRADERS' RESOURCE. | |
Click here for more information about our publications!
PRINT THIS ARTICLE

Request Information From Our Sponsors
- StockCharts.com, Inc.
- Candle Patterns
- Candlestick Charting Explained
- Intermarket Technical Analysis
- John Murphy on Chart Analysis
- John Murphy's Chart Pattern Recognition
- John Murphy's Market Message
- MurphyExplainsMarketAnalysis-Intermarket Analysis
- MurphyExplainsMarketAnalysis-Visual Analysis
- StockCharts.com
- Technical Analysis of the Financial Markets
- The Visual Investor
- VectorVest, Inc.
- Executive Premier Workshop
- One-Day Options Course
- OptionsPro
- Retirement Income Workshop
- Sure-Fire Trading Systems (VectorVest, Inc.)
- Trading as a Business Workshop
- VectorVest 7 EOD
- VectorVest 7 RealTime/IntraDay
- VectorVest AutoTester
- VectorVest Educational Services
- VectorVest OnLine
- VectorVest Options Analyzer
- VectorVest ProGraphics v6.0
- VectorVest ProTrader 7
- VectorVest RealTime Derby Tool
- VectorVest Simulator
- VectorVest Variator
- VectorVest Watchdog