

HOT TOPICS LIST
- MACD
- Fibonacci
- RSI
- Gann
- ADXR
- Stochastics
- Volume
- Triangles
- Futures
- Cycles
- Volatility
- ZIGZAG
- MESA
- Retracement
- Aroon
INDICATORS LIST
LIST OF TOPICS
PRINT THIS ARTICLE
by Donald W. Pendergast, Jr.
Shares of Priceline.com have been hit hard over the past three weeks; will the "smart money" step in to buy again soon?
Position: N/A
Donald W. Pendergast, Jr.
Freelance financial markets writer and online publisher of the Trendzetterz.com S&P 500 Weekly Forecast service.
PRINT THIS ARTICLE
CHAIKIN OSCILLATOR
Priceline.com: Buyers To The Rescue?
04/03/14 03:46:18 PMby Donald W. Pendergast, Jr.
Shares of Priceline.com have been hit hard over the past three weeks; will the "smart money" step in to buy again soon?
Position: N/A
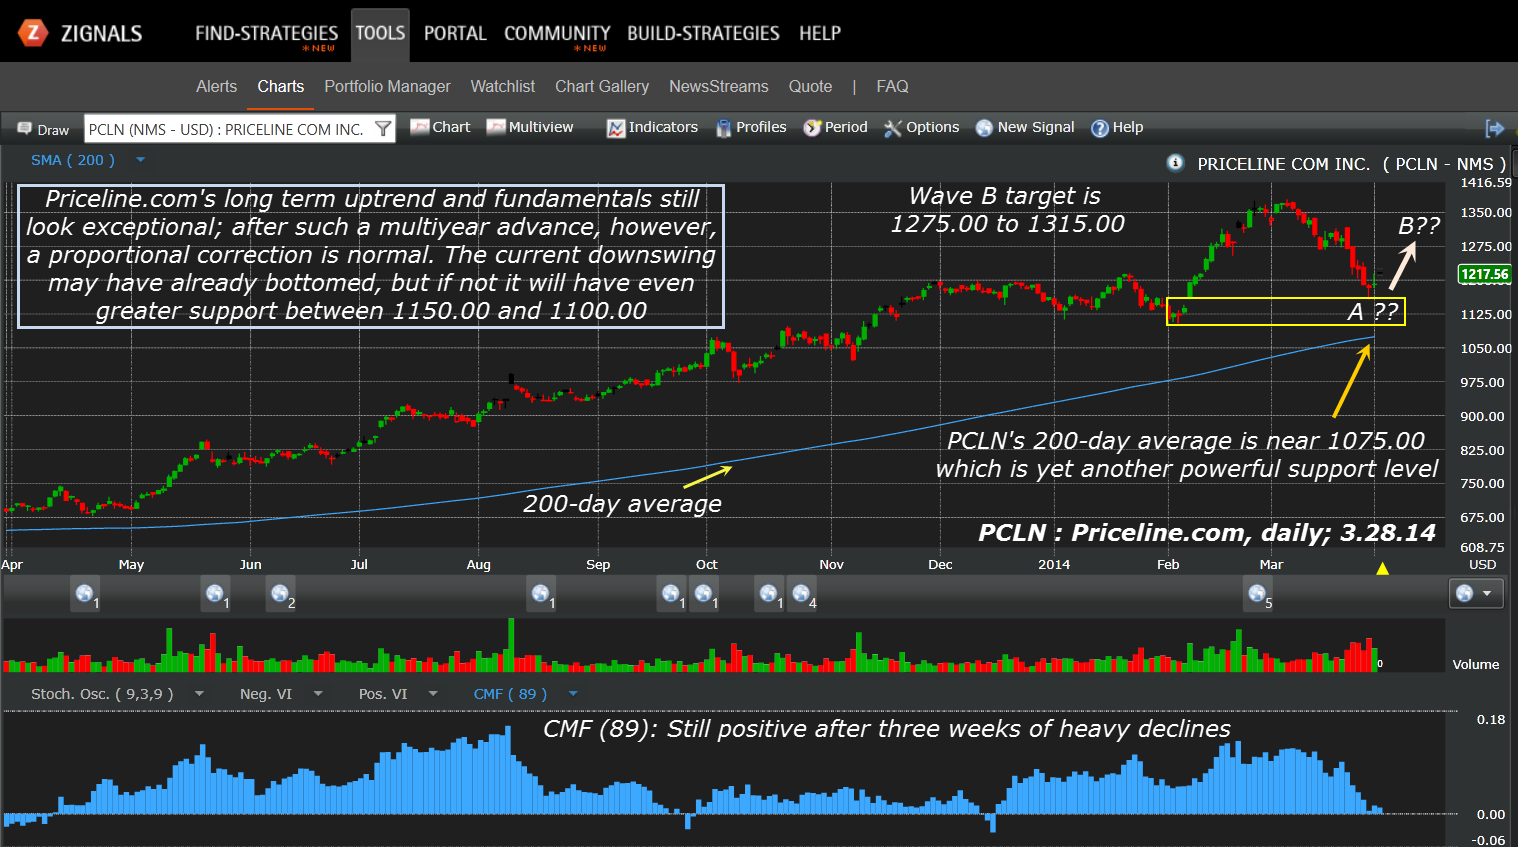
| Down by 16% since March 6, 2014, shares of Priceline.com (PCLN) are now in what appears to be the first stage of an Elliott Wave ABC correction, one that could eventually see the stock dip back into the lower $900.00 range by the time the dust settles. But for now, it's possible that the worst of PCLN's wave A decline is close to completion and that the onset of a bullish wave B could be seen sometime in April 2014. How this turns out depends on how enthusiastic the so-called "smart money" become as PCLN hits the major support zone between 1100.00 and 1150.00 — and the odds look good that they will indeed come to the rescue for this stock – for a time, anyway. Here's a closer look (Figure 1). |
|
| Figure 1. Priceline.com (PCLN) should have little trouble attracting institutional buying anywhere near the yellow support zone (1100.00 to 1150.00), thus initiating a B-wave relief rally. |
| Graphic provided by: Zignals.com. |
| |
| After a strong correction in a large cap stock that has enjoyed a massive run-up over a multiyear period, one of the best (and most effective) means to forecast a strong relief rally is to look at two primary indicators: 1. Check to see if the 89-period Chaikin money flow histogram (CMF)(89) remains at or above its zero line once the first major correction occurs. 2. Verify that the 200-day simple moving average (SMA) is still sloping higher and that the stock is trading above it. This is a basic framework to be sure, but if both of these are positive at the time wave A terminates, you have an above average chance of seeing a strong wave B relief rally develop in the near future. On this daily chart for PCLN you find that the stock easily passes both tests; note also that wave A is now resting on top of a major support zone that stretches from 1100.00 to 1150.00 and that any further dips into the yellow box on the chart should see the smart money move in to get the B wave rally fires lit. |
|
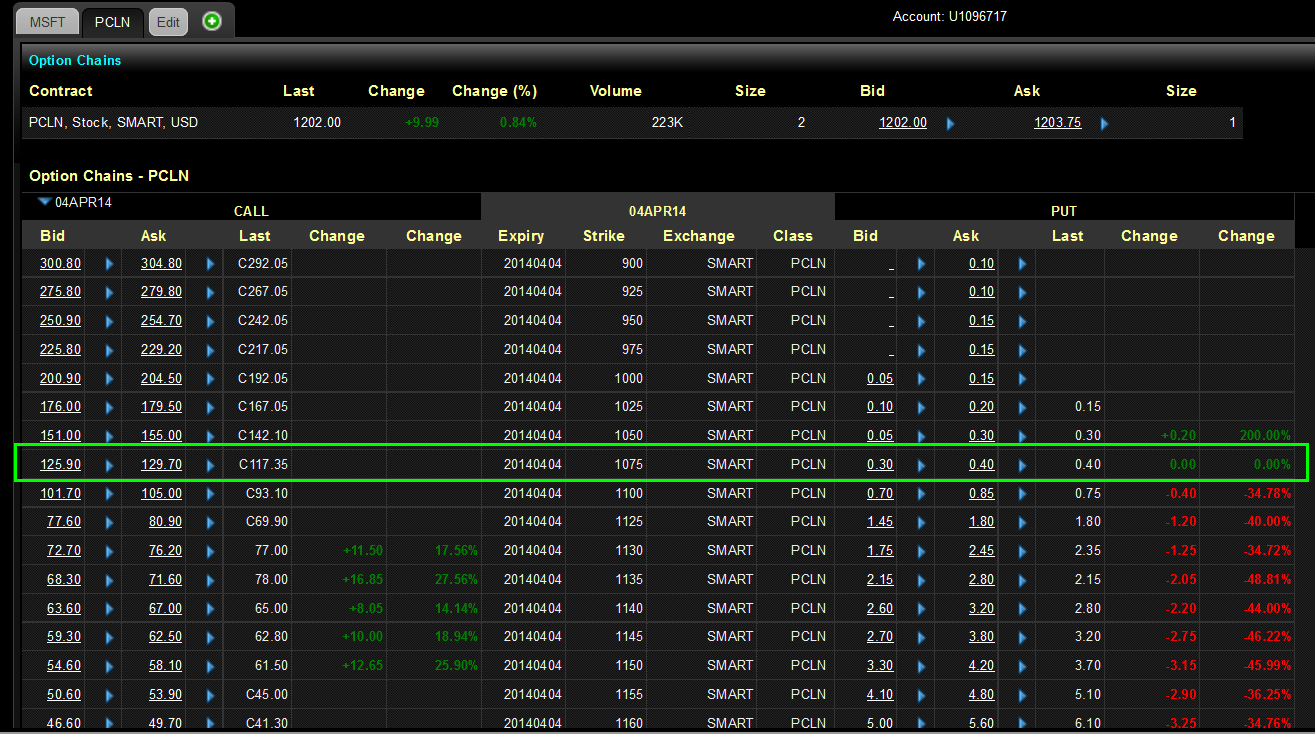
| Figure 2. Although the bid-ask spread isn't great, a good case for selling the April '14 PCLN $1075.00 put option can be made here, given the likelihood of a strong B-wave rally soon. |
| Graphic provided by: Interactive Brokers LLC. |
| |
| If wave B has already begun its rise, look for it to terminate somewhere between 1275.00 and 1315.00 toward the latter end of April 2014, followed by a strong wave C that could last well into the summer of 2014. Playing the B wave bounce here might be most easily done by selling near-term out-of-the-money put options with a strike price below the 200-day SMA (1075.00). This is a great, modest-risk strategy in a stock that is trading just above a strong support zone — as long as it has positive long-term money flow and an upward sloping 200-day SMA. Make sure you can watch such a short option position in real-time and by no means hold the position if the major support zone is breached; also be sure to cover the put and take profits if its value withers by 75-80% in a relatively short period of time. Keep your account risk at 1% maximum and remember to trade wisely until we meet here again. |
Freelance financial markets writer and online publisher of the Trendzetterz.com S&P 500 Weekly Forecast service.
| Title: | Market consultant and writer |
| Company: | Trendzetterz |
| Address: | 81 Hickory Hollow Drive |
| Crossville, TN 38555 | |
| Phone # for sales: | 904-303-4814 |
| Website: | trendzetterz.com |
| E-mail address: | support@trendzetterz.com |
Traders' Resource Links | |
| Trendzetterz has not added any product or service information to TRADERS' RESOURCE. | |
Click here for more information about our publications!
PRINT THIS ARTICLE

Request Information From Our Sponsors
- StockCharts.com, Inc.
- Candle Patterns
- Candlestick Charting Explained
- Intermarket Technical Analysis
- John Murphy on Chart Analysis
- John Murphy's Chart Pattern Recognition
- John Murphy's Market Message
- MurphyExplainsMarketAnalysis-Intermarket Analysis
- MurphyExplainsMarketAnalysis-Visual Analysis
- StockCharts.com
- Technical Analysis of the Financial Markets
- The Visual Investor
- VectorVest, Inc.
- Executive Premier Workshop
- One-Day Options Course
- OptionsPro
- Retirement Income Workshop
- Sure-Fire Trading Systems (VectorVest, Inc.)
- Trading as a Business Workshop
- VectorVest 7 EOD
- VectorVest 7 RealTime/IntraDay
- VectorVest AutoTester
- VectorVest Educational Services
- VectorVest OnLine
- VectorVest Options Analyzer
- VectorVest ProGraphics v6.0
- VectorVest ProTrader 7
- VectorVest RealTime Derby Tool
- VectorVest Simulator
- VectorVest Variator
- VectorVest Watchdog