HOT TOPICS LIST
- MACD
- Fibonacci
- RSI
- Gann
- ADXR
- Stochastics
- Volume
- Triangles
- Futures
- Cycles
- Volatility
- ZIGZAG
- MESA
- Retracement
- Aroon
INDICATORS LIST
LIST OF TOPICS
PRINT THIS ARTICLE
by Koos van der Merwe
When a trading strategy I use suggests a buy, I then take a closer look at the share.
Position: Buy
Koos van der Merwe
Has been a technical analyst since 1969, and has worked as a futures and options trader with First Financial Futures in Johannesburg, South Africa.
PRINT THIS ARTICLE
ELLIOTT WAVE
Johnson Controls Inc.
04/04/14 04:13:49 PMby Koos van der Merwe
When a trading strategy I use suggests a buy, I then take a closer look at the share.
Position: Buy
| Johnson Controls Inc (NYSE: JCI), is a global multi-industrial company with established core businesses in the automotive, building and energy storage industries. It has recently announced the introduction of a smart thermostat with Wi-Fi capabilities. This will allow homeowners to use mobile devices to remotely monitor their home comfort systems, enabling them to make energy-saving adjustments to system settings. |

|
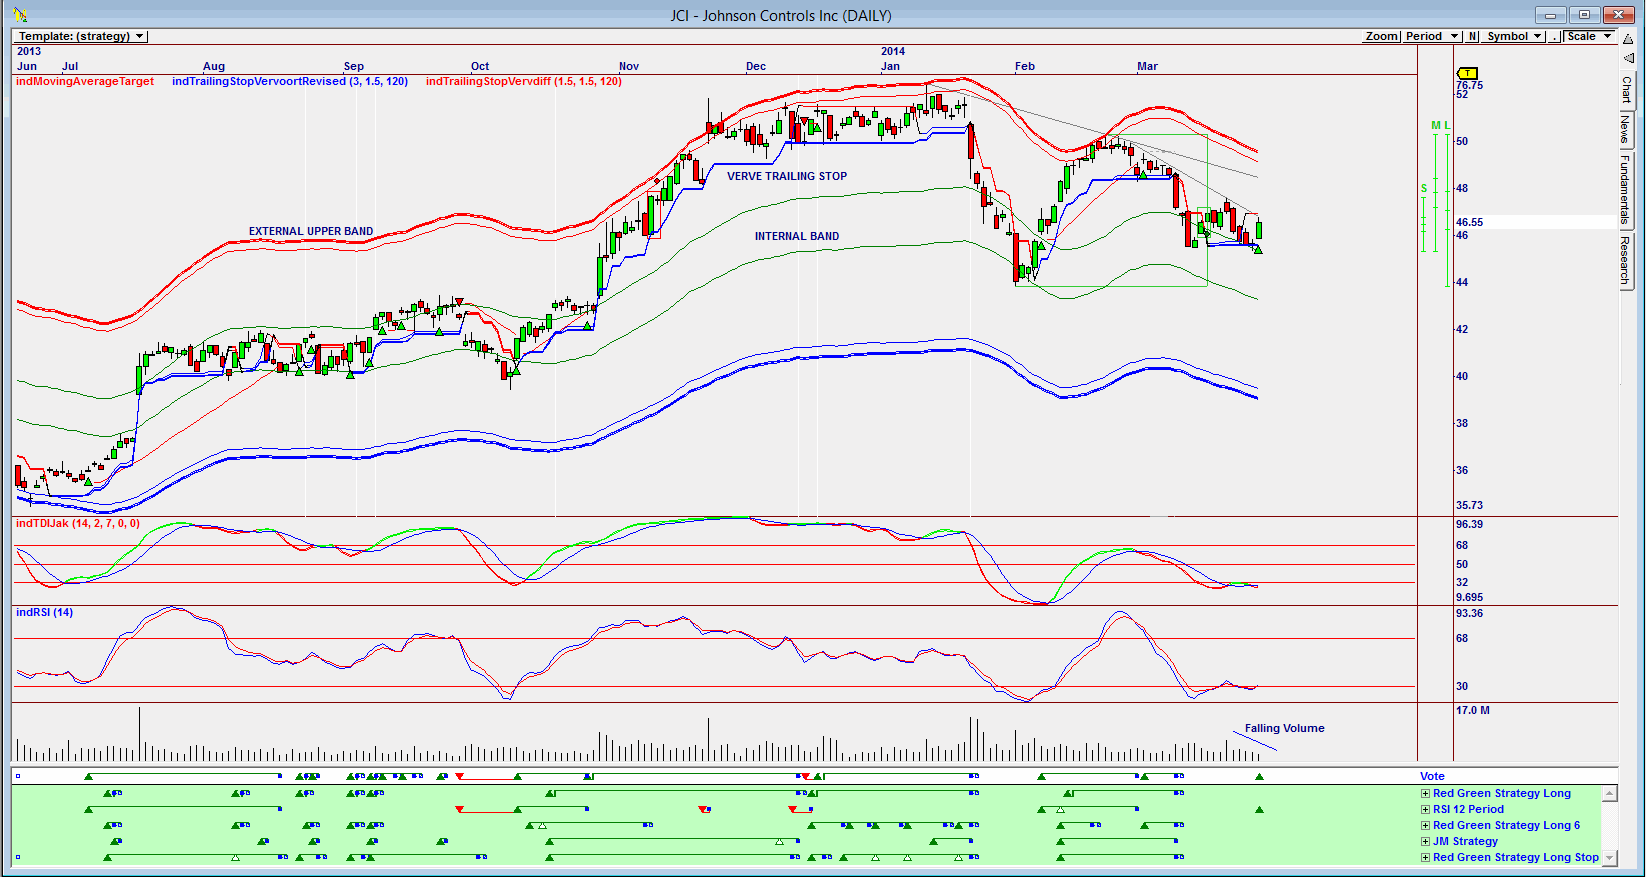
| Figure 1. Omnitrader chart showing the buy signal given on the Vote line. |
| Graphic provided by: Omnitrader. |
| |
| The chart in Figure 1 is an Omnitrader chart with the Vote line showing a buy signal. The buy signal was triggered by the RSI 12-period strategy. That only one strategy has given a buy signal is disturbing. I would prefer, at the very least, two strategies suggesting a buy. However, looking back over the chart, I can see that one or two days later a second strategy does trigger a buy signal, so the share price needs further investigation. Note on the chart that the price bounces off the upper external band, and finds support on the lower internal band. The share price is presently on the upper internal band, suggesting the price could correct down. However, the RSI indicator and the TDIJak indicator are suggesting buys. Finally, note the falling volume as the price fell, suggesting strength. |

|
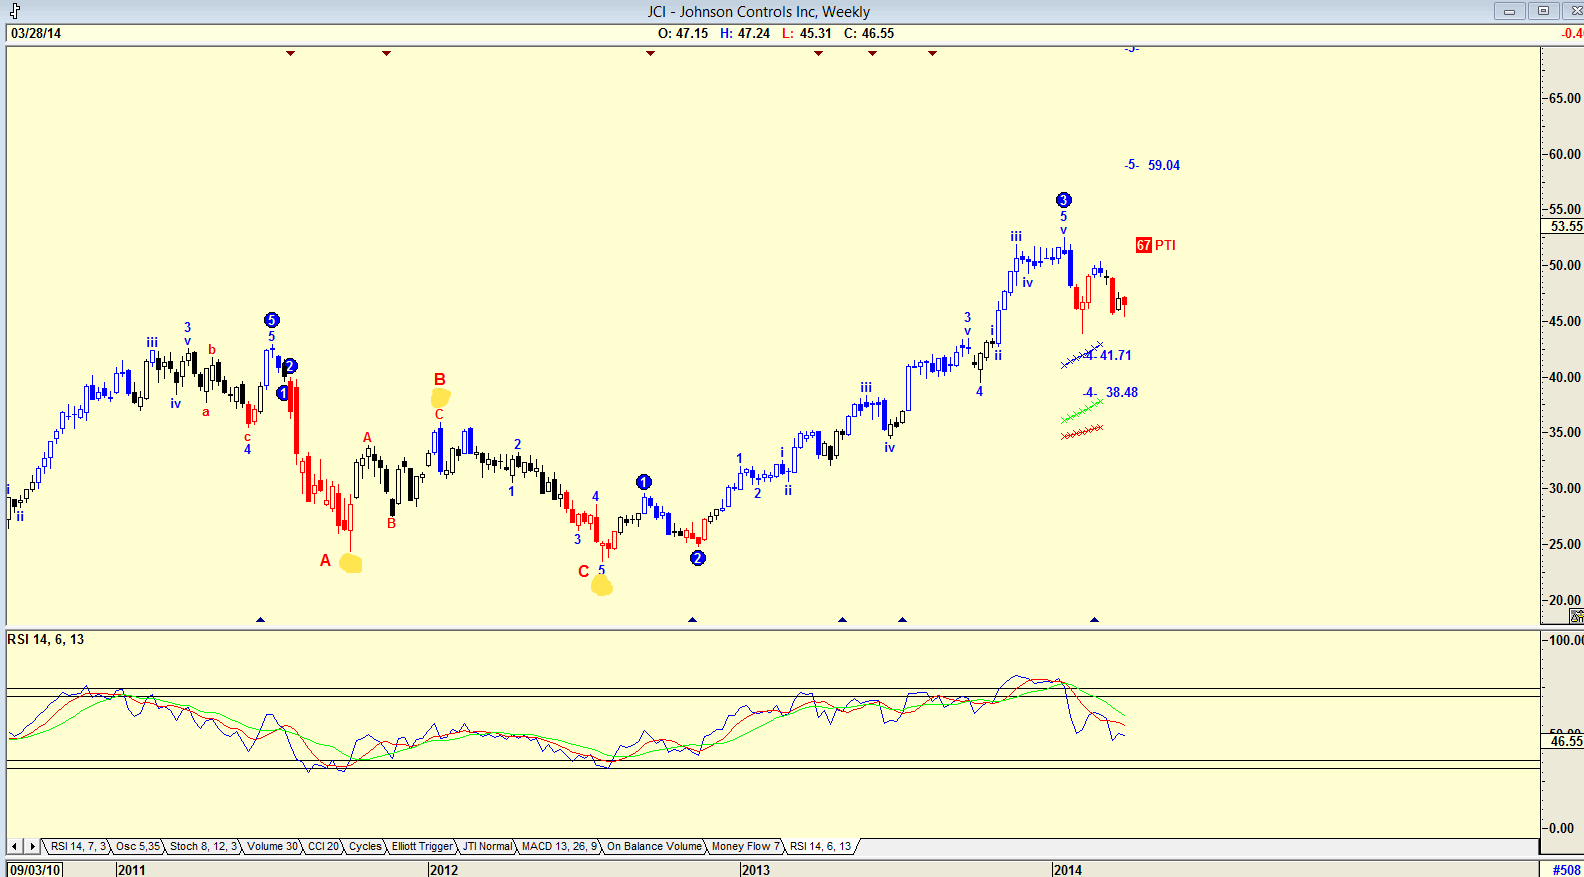
| Figure 2. A weekly chart of JCI with an Elliott Wave count. |
| Graphic provided by: AdvancedGET. |
| |
| Because of the doubt cast by the Omnitrader buy signal given in Figure 1, I decided to look at a weekly Elliott Wave chart to see what is suggested. The chart in Figure 2 shows an Elliott Wave count suggesting that the price could still fall in a Wave 4 correction to either the $41.71 level or the $38.48 level. The RSI 14-period shown is showing weakness. |

|
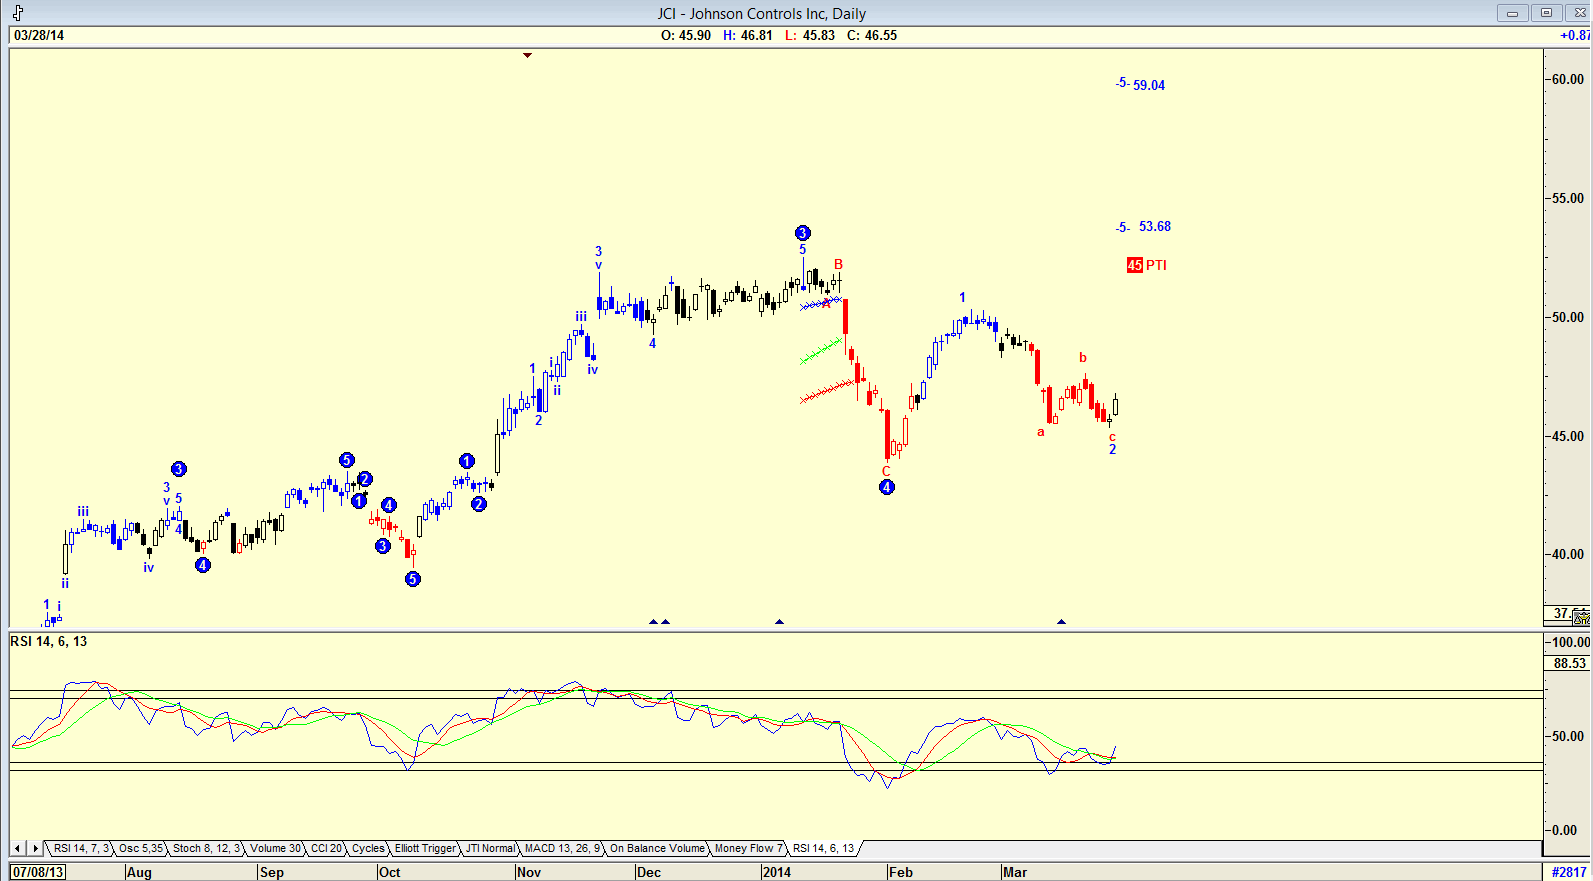
| Figure 3. A daily chart with an Elliott Wave count suggesting a buy. |
| Graphic provided by: AdvancedGET. |
| |
| Finally, the daily chart with an Elliott Wave count suggests that the share price could have completed a Wave 1 and a Wave 2 correction in a WAVE 5. The target predicted for the WAVE 5 is either $53.68 or $59.04. The PTI (Probability Index) shown is 45. Any PTI greater than 32 is a sign of success. With the RSI giving a buy signal, you could seriously consider buying the share. I am a buyer of JCI at current levels, but because of the negativity suggested in the weekly chart shown in Figure 2, I will keep my stops close. |
Has been a technical analyst since 1969, and has worked as a futures and options trader with First Financial Futures in Johannesburg, South Africa.
| Address: | 3256 West 24th Ave |
| Vancouver, BC | |
| Phone # for sales: | 6042634214 |
| E-mail address: | petroosp@gmail.com |
Click here for more information about our publications!
PRINT THIS ARTICLE

Request Information From Our Sponsors
- StockCharts.com, Inc.
- Candle Patterns
- Candlestick Charting Explained
- Intermarket Technical Analysis
- John Murphy on Chart Analysis
- John Murphy's Chart Pattern Recognition
- John Murphy's Market Message
- MurphyExplainsMarketAnalysis-Intermarket Analysis
- MurphyExplainsMarketAnalysis-Visual Analysis
- StockCharts.com
- Technical Analysis of the Financial Markets
- The Visual Investor
- VectorVest, Inc.
- Executive Premier Workshop
- One-Day Options Course
- OptionsPro
- Retirement Income Workshop
- Sure-Fire Trading Systems (VectorVest, Inc.)
- Trading as a Business Workshop
- VectorVest 7 EOD
- VectorVest 7 RealTime/IntraDay
- VectorVest AutoTester
- VectorVest Educational Services
- VectorVest OnLine
- VectorVest Options Analyzer
- VectorVest ProGraphics v6.0
- VectorVest ProTrader 7
- VectorVest RealTime Derby Tool
- VectorVest Simulator
- VectorVest Variator
- VectorVest Watchdog
