HOT TOPICS LIST
- MACD
- Fibonacci
- RSI
- Gann
- ADXR
- Stochastics
- Volume
- Triangles
- Futures
- Cycles
- Volatility
- ZIGZAG
- MESA
- Retracement
- Aroon
INDICATORS LIST
LIST OF TOPICS
PRINT THIS ARTICLE
by Koos van der Merwe
When a chart of an exchange traded fund suggests an inverse head & shoulders formation, with a larger one in the offing, is this a signal of what is to come overall?
Position: Sell
Koos van der Merwe
Has been a technical analyst since 1969, and has worked as a futures and options trader with First Financial Futures in Johannesburg, South Africa.
PRINT THIS ARTICLE
HEAD & SHOULDERS
An Inverse Head & Shoulders
04/03/14 03:36:26 PMby Koos van der Merwe
When a chart of an exchange traded fund suggests an inverse head & shoulders formation, with a larger one in the offing, is this a signal of what is to come overall?
Position: Sell
| An exchange traded fund (ETF) is almost like an index, in that the underlying expenses of a corporation are not present. A mining company has expenses that can influence its stock price, but when a number of mining companies are all lumped together in an ETF, the risk is reduced. When an ETF then suddenly suggests a trend reversal, it is therefore an indication of "those in the know" reading the market and making a decision. So, when the i-Shares Gold Index (XGD-T) listed on the Toronto Stock Exchange and the ETF Spider Gold Trust (GLD) listed on the New York Stock Exchange both say "look at me and what I am suggesting", I take a serious look. |

|
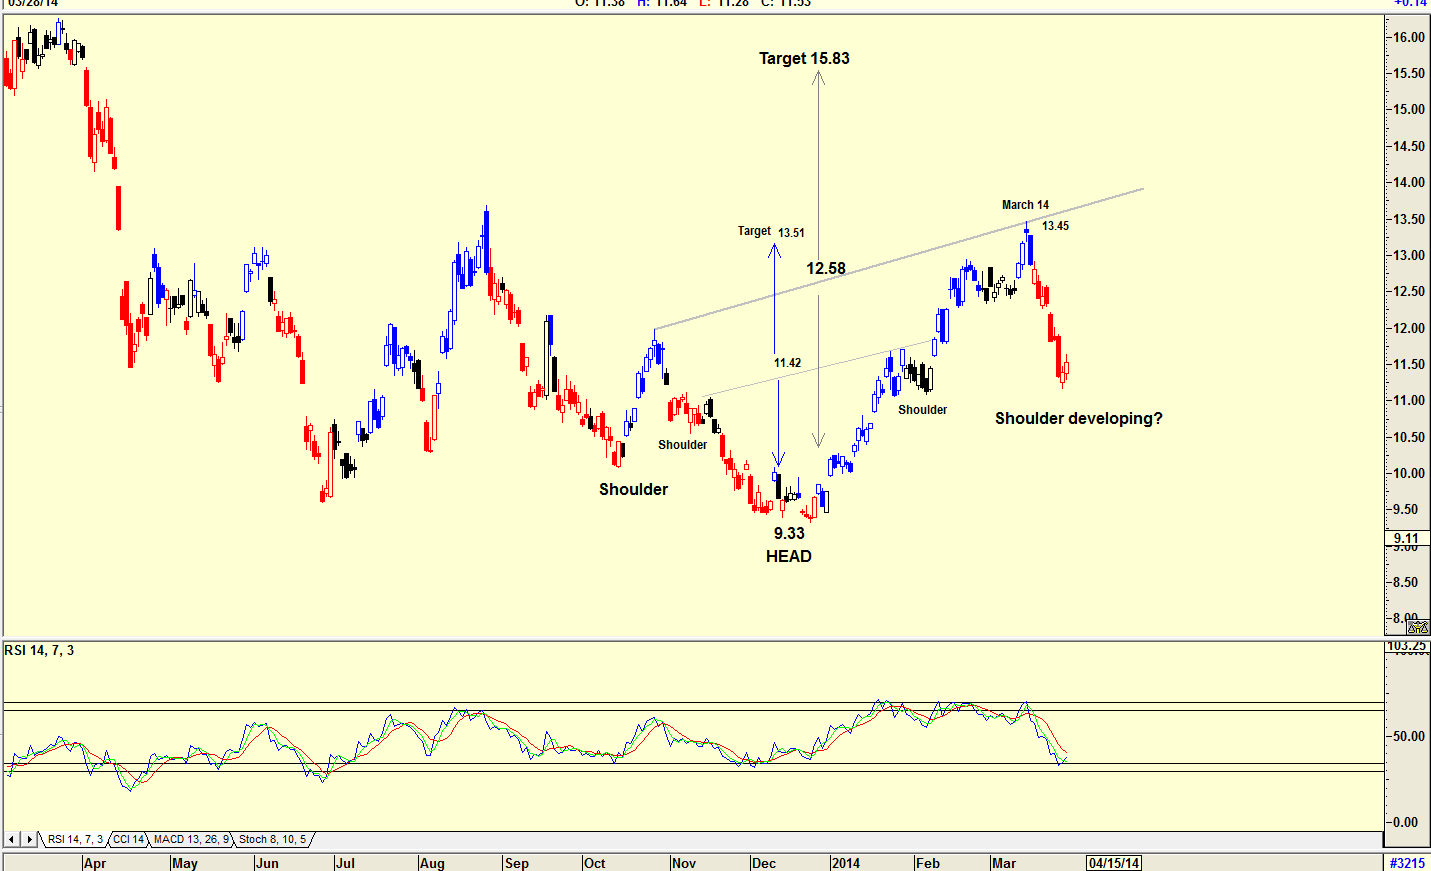
| Figure 1. Daily chart of the i-Shares Gold Index. |
| Graphic provided by: AdvancedGET. |
| |
| The daily chart of XGD-T in Figure 1 is showing an inverse head & shoulders chart pattern suggesting a target of $13.51(11.42-9.33=2.09; 11.42+2.09=13.51). The share price came close to hitting that target on March 14, 2014. Looking further at the chart, you can see what looks like a larger inverse head & shoulders pattern developing. Should this larger pattern materialize, and this will only happen if and when the price breaks above the $13.45 price level, then the target suggested is $15.83 (12.58-9.33 =3.25; 12.58+3.25 = 15.83). Will this target be reached? With the RSI at oversold levels and suggesting a buy, this could occur. |

|
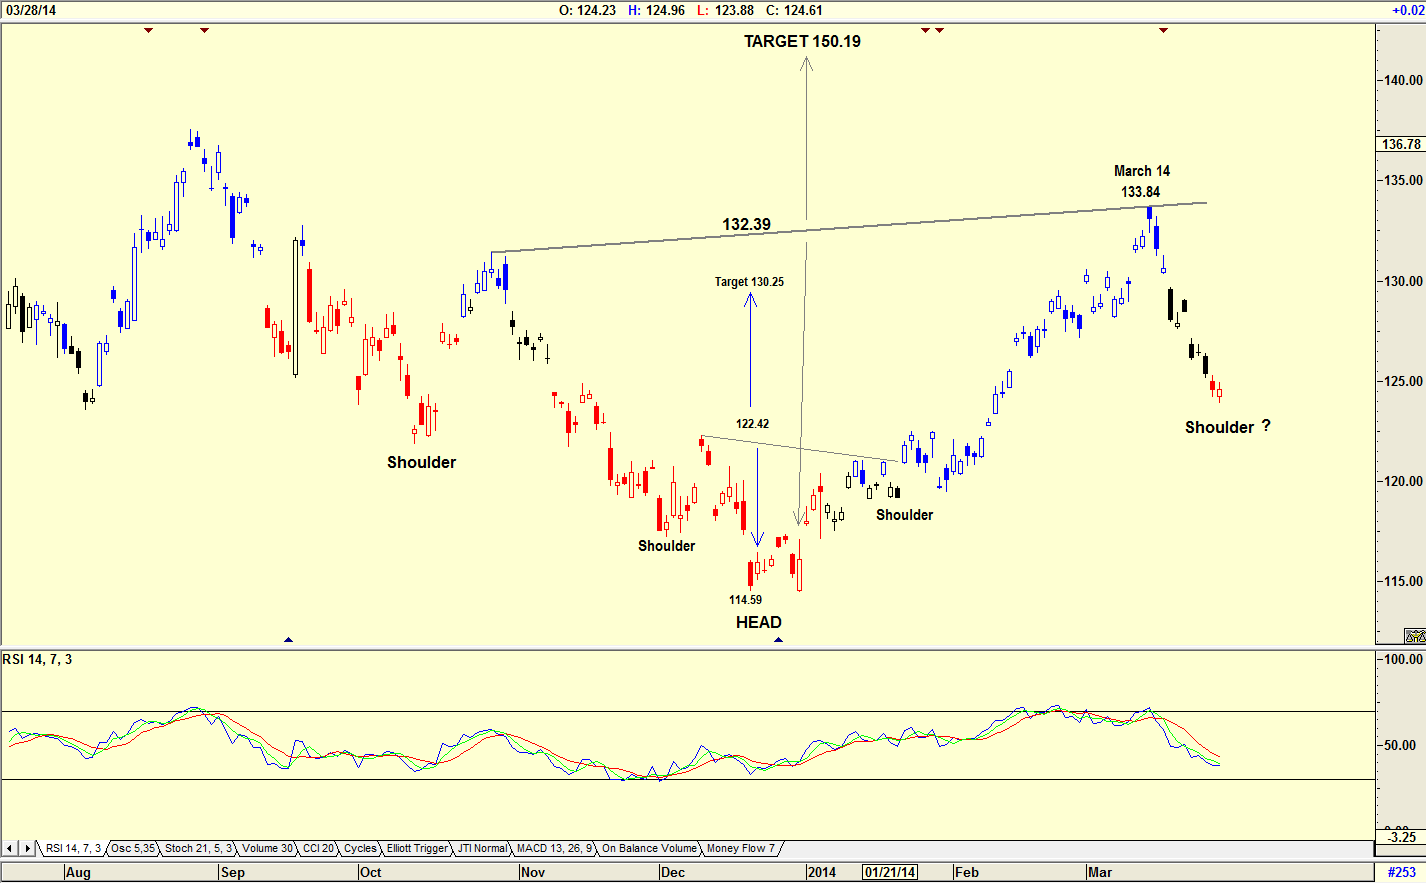
| Figure 2. Daily chart of the ETF Spider Gold Trust. |
| Graphic provided by: AdvancedGET. |
| |
| The chart of GLD in Figure 2 shows an inverse head & shoulders pattern that has developed suggesting a target of $130.25 (122,42 - 114.59 = 7.83; 122.42 + 7.83 = 130.25) but the larger inverse head & shoulders pattern suggested on the chart looks unlikely. The RSI indicator for one is not at oversold levels, suggesting that the price could fall further. The price of $133.84 reached on March 14, 2014 is close to the target price suggested by the inverse head & shoulders pattern as shown on the chart. A smaller inverse head & shoulders pattern can lead to a larger one which should not be ignored, but accept the first inverse head & shoulders pattern as the ultimate, and should the second one finalize itself, say thank you for the new target. |
Has been a technical analyst since 1969, and has worked as a futures and options trader with First Financial Futures in Johannesburg, South Africa.
| Address: | 3256 West 24th Ave |
| Vancouver, BC | |
| Phone # for sales: | 6042634214 |
| E-mail address: | petroosp@gmail.com |
Click here for more information about our publications!
PRINT THIS ARTICLE

Request Information From Our Sponsors
- StockCharts.com, Inc.
- Candle Patterns
- Candlestick Charting Explained
- Intermarket Technical Analysis
- John Murphy on Chart Analysis
- John Murphy's Chart Pattern Recognition
- John Murphy's Market Message
- MurphyExplainsMarketAnalysis-Intermarket Analysis
- MurphyExplainsMarketAnalysis-Visual Analysis
- StockCharts.com
- Technical Analysis of the Financial Markets
- The Visual Investor
- VectorVest, Inc.
- Executive Premier Workshop
- One-Day Options Course
- OptionsPro
- Retirement Income Workshop
- Sure-Fire Trading Systems (VectorVest, Inc.)
- Trading as a Business Workshop
- VectorVest 7 EOD
- VectorVest 7 RealTime/IntraDay
- VectorVest AutoTester
- VectorVest Educational Services
- VectorVest OnLine
- VectorVest Options Analyzer
- VectorVest ProGraphics v6.0
- VectorVest ProTrader 7
- VectorVest RealTime Derby Tool
- VectorVest Simulator
- VectorVest Variator
- VectorVest Watchdog
