HOT TOPICS LIST
- MACD
- Fibonacci
- RSI
- Gann
- ADXR
- Stochastics
- Volume
- Triangles
- Futures
- Cycles
- Volatility
- ZIGZAG
- MESA
- Retracement
- Aroon
INDICATORS LIST
LIST OF TOPICS
PRINT THIS ARTICLE
by Donald W. Pendergast, Jr.
Using Fibonacci swing ratios can help you better forecast high probability support/resistance points in most liquid stocks and exchange traded funds.
Position: N/A
Donald W. Pendergast, Jr.
Freelance financial markets writer and online publisher of the Trendzetterz.com S&P 500 Weekly Forecast service.
PRINT THIS ARTICLE
SWING CHART
Eastman Chemical: Swing CD Heads South
04/01/14 04:25:41 PMby Donald W. Pendergast, Jr.
Using Fibonacci swing ratios can help you better forecast high probability support/resistance points in most liquid stocks and exchange traded funds.
Position: N/A
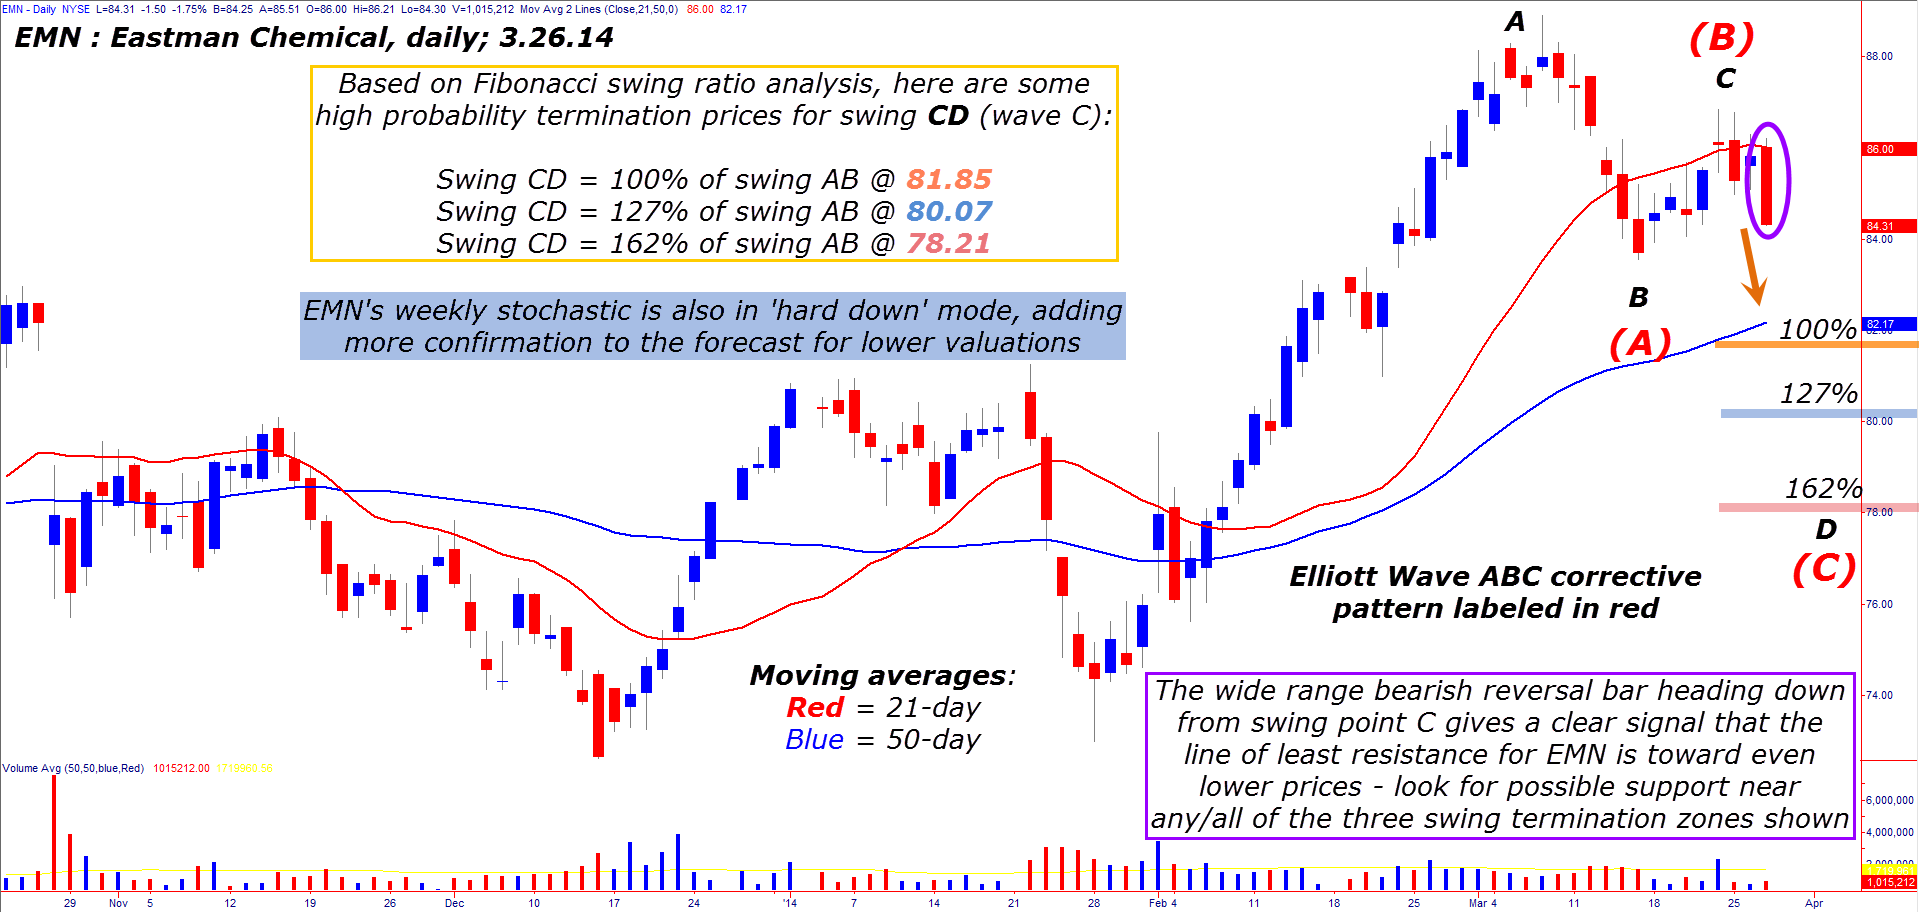
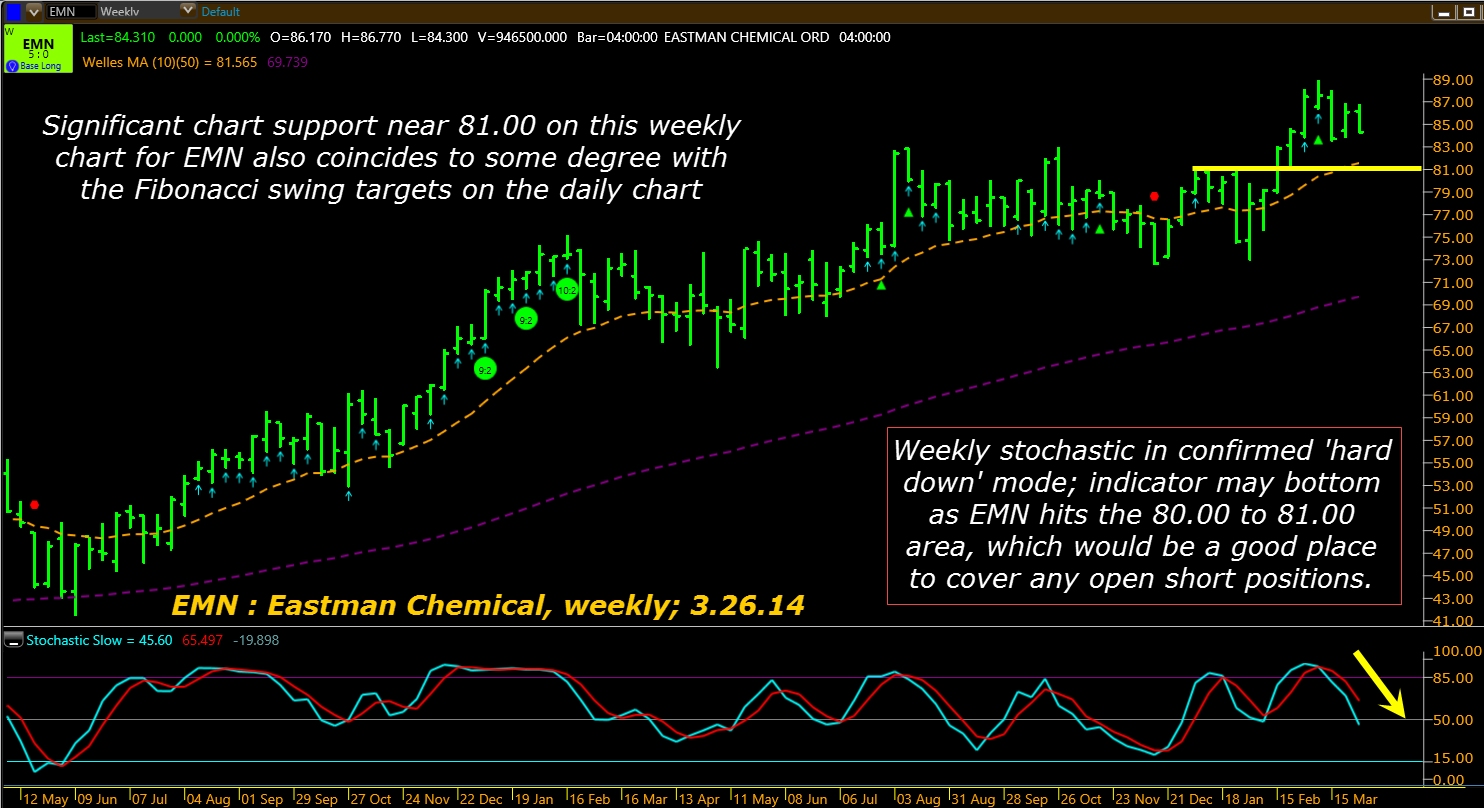
| Of all the large cap issues in the S&P 500 index (.SPX), few have enjoyed as persistent a rally as those of Eastman Chemical (EMN). From a bargain-basement low of 8.88 in March 2009, the stock proceeded to gain as much as 901% by the time March 2014 rolled around. Think of that — an average (non-compounded) annual return of 180% in an era of sub-1%, Depression era savings account yields. Surely, it is worth traders' and investors' time and effort to learn the basics of successful, consistently profitable market tactics and techniques, and in this article, we'll look at a valuable 'leading indicator' with good predictive ability that traders/investors alike can utilize again and again. Here's a closer look now, using EMN's daily (Figure 1) and weekly (Figure 2) charts. |

|
| Figure 1. Eastman Chemical's (EMN) current set of corrective waves are implying that the line of least resistance for this S&P 500 (.SPX) component is toward lower prices — look for support to manifest between 80.07 to 81.85. |
| Graphic provided by: TradeStation. |
| |
| The bullish run for EMN has been breathtaking, but even a mega rally like this one needs some time to pause, correct/consolidate, and test support before making a move to perhaps even higher all-time highs. Then again, even a mega rally ends at some point, followed by a major bearish trend reversal, one that can erase 38%, 50% or even 62% of the previous gains in a comparatively short period of time. While no one knows if EMN is now destined for a minor (proportional) correction or an outright nasty bear market, we can rely on several basic trend momentum and Fibonacci tools to help us in our attempts to make money from this — or any other stock. Okay, so the big deal here in EMC is simple and straightforward: 1. A beauty of an AB=CD Fibonacci swing ratio pattern is in full bloom on EMN's daily chart. 2. The weekly chart shows a very bearish, full-tilt stochastic indicator. 3. The powerful, wide-range bearish candle on March 26 proved there was an abundance of stock available for sale in the 86.00/87.00 area; swing CD is now well underway after rejection of that resistance zone. 4. The next major weekly chart support is near 81.00. 5. Fibonacci swing ratio analysis suggests these will be potential termination zones for swing CD (see chart for visuals). 100% of swing AB @ 81.85 127% of swing AB @ 80.07 162% of swing AB @ 78.21 Just using your eyes to locate major support zones (the gold horizontal line on the weekly chart) and then doing some basic Fib swing math allows you to quickly discern that the zone between 80.07 and 81.85 is going to be the first meaningful support zone for EMR; if this zone fails after a minor bounce then we know that the zone between 78.21 and 80.07 becomes the next high probability support zone. The trading/investing game is all about knowing what the probabilities are, and then trading in accordance with those offering the most likely chance of success. |

|
| Figure 2. EMN's weekly stochastic paints a very bearish picture, at least until the support near 81.00 is challenged. |
| Graphic provided by: KnowVera Research LLC. |
| |
| Given the tremendous downward forces at work in EMN right now, it's a low risk trade to go short here, as follows: 1. Use 85.50 as your initial stop (a bit above the daily 10-bar average) after going short on a drop below 82.25 — this is $1.25 of trade risk. 2. Use 81.50 as your initial profit target and take at least half if not all of your open gains there if not stopped out first. 3. Use a three-bar trailing stop of the daily highs to manage the position as the trade plays out. 4. Truly skilled traders can attempt to hold on for bigger gains beyond the first support zone, but would still be well advised to take partial gains anyway to limit the risk of a short covering rally. Keep your account risk at 1 to 2% maximum. Trade wisely until we meet here again. |
Freelance financial markets writer and online publisher of the Trendzetterz.com S&P 500 Weekly Forecast service.
| Title: | Market consultant and writer |
| Company: | Trendzetterz |
| Address: | 81 Hickory Hollow Drive |
| Crossville, TN 38555 | |
| Phone # for sales: | 904-303-4814 |
| Website: | trendzetterz.com |
| E-mail address: | support@trendzetterz.com |
Traders' Resource Links | |
| Trendzetterz has not added any product or service information to TRADERS' RESOURCE. | |
Click here for more information about our publications!
PRINT THIS ARTICLE

Request Information From Our Sponsors
- VectorVest, Inc.
- Executive Premier Workshop
- One-Day Options Course
- OptionsPro
- Retirement Income Workshop
- Sure-Fire Trading Systems (VectorVest, Inc.)
- Trading as a Business Workshop
- VectorVest 7 EOD
- VectorVest 7 RealTime/IntraDay
- VectorVest AutoTester
- VectorVest Educational Services
- VectorVest OnLine
- VectorVest Options Analyzer
- VectorVest ProGraphics v6.0
- VectorVest ProTrader 7
- VectorVest RealTime Derby Tool
- VectorVest Simulator
- VectorVest Variator
- VectorVest Watchdog
- StockCharts.com, Inc.
- Candle Patterns
- Candlestick Charting Explained
- Intermarket Technical Analysis
- John Murphy on Chart Analysis
- John Murphy's Chart Pattern Recognition
- John Murphy's Market Message
- MurphyExplainsMarketAnalysis-Intermarket Analysis
- MurphyExplainsMarketAnalysis-Visual Analysis
- StockCharts.com
- Technical Analysis of the Financial Markets
- The Visual Investor
