

HOT TOPICS LIST
- MACD
- Fibonacci
- RSI
- Gann
- ADXR
- Stochastics
- Volume
- Triangles
- Futures
- Cycles
- Volatility
- ZIGZAG
- MESA
- Retracement
- Aroon
INDICATORS LIST
LIST OF TOPICS
PRINT THIS ARTICLE
by Donald W. Pendergast, Jr.
Once Mattel's current bear market bounce completes, expect another wave of selling to commence.
Position: N/A
Donald W. Pendergast, Jr.
Freelance financial markets writer and online publisher of the Trendzetterz.com S&P 500 Weekly Forecast service.
PRINT THIS ARTICLE
RETRACEMENT
MAT: Bear Market Bounce
03/31/14 05:42:02 PMby Donald W. Pendergast, Jr.
Once Mattel's current bear market bounce completes, expect another wave of selling to commence.
Position: N/A
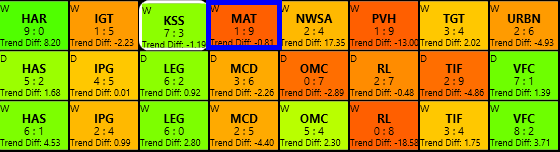
| After a vicious seven-week sell-off in January/February 2014, Mattel (MAT) shares are enjoying a minor relief rally; novice traders might be tempted to interpret the stock's 11% rally off its late February 2014 lows as a sign of strength, but more experienced market participants know that the "bigger picture" for MAT is still bearish and that this latest bounce is likely to fail in the near future, with another strong round of selling due. Here's a closer look at MAT's weekly chart (Figure 2). |
|
| Figure: 1. Mattel (MAT) has a very bearish weekly chart trend score of 1:9 and is also ranked as a "base short." |
| Graphic provided by: KnowVera Research LLC. |
| |
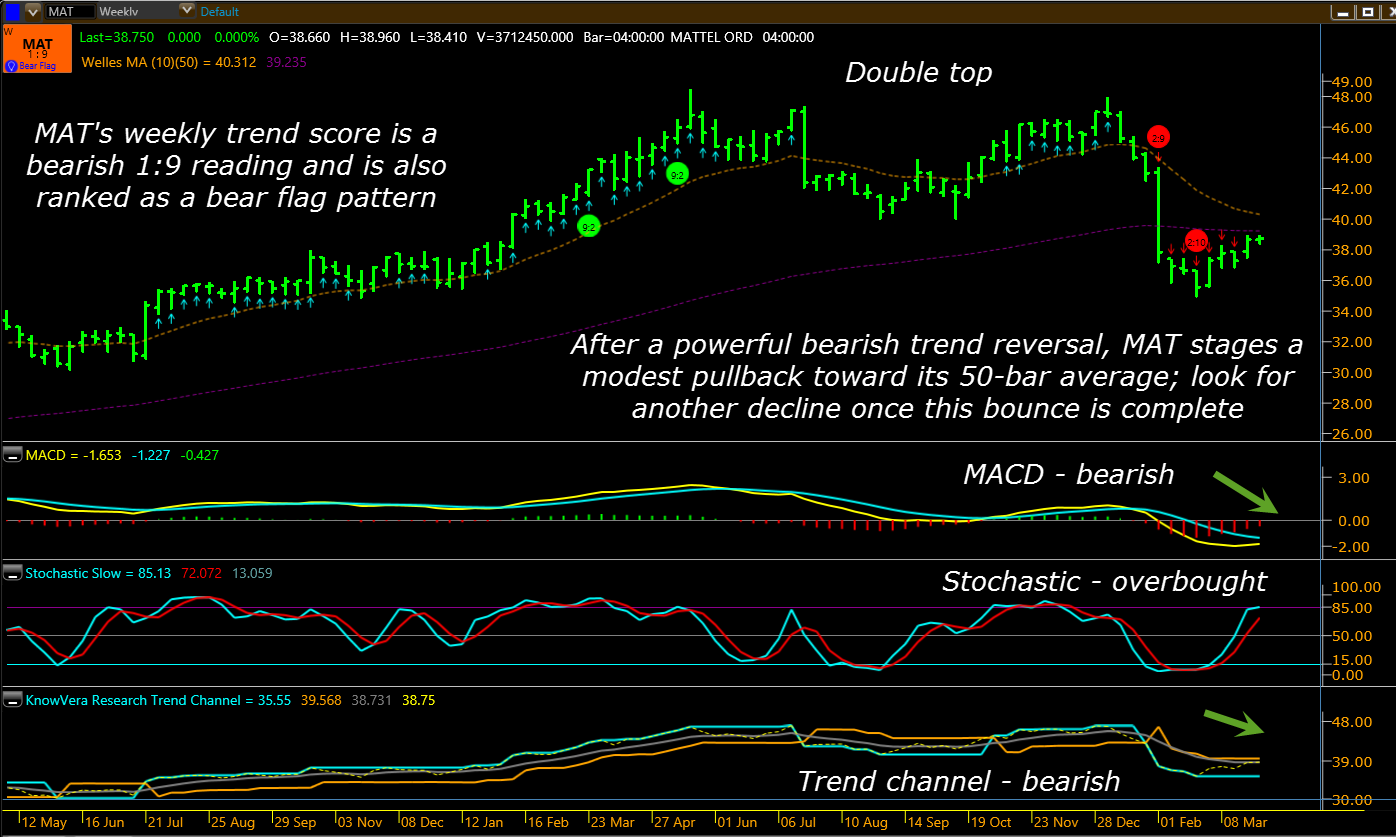
| When analyzing a chart to lay out a rational set of high probability price predictions, always look at two things before you start: 1. Locate the most recent trend reversal or continuation event. 2. Look at higher time frame charts to understand how short-term price action fits in with longer term dynamics. In this weekly chart example for MAT, we see a super wide range weekly sell-off bar (W/E 2.1.14), one that caused a weekly close below the 50-week average. Major shock price events like this are typically good predictors of future price direction and are not quickly reversed in most cases. Secondly, if you glance at MAT's monthly chart (not shown), you also find that an even bigger wide range shock sell off bar caused the stock to close beneath its monthly 10-bar average. This agreement between the weekly and monthly time frames implies that a major, bearish trend reversal is underway in MAT and that traders should be looking for suitable shorting opportunities in the days and weeks (months) ahead. Viewing the key trend dynamics for MAT, we also find that: 1. The weekly and monthly chart MACDs are bearish. 2. The weekly and monthly chart trend channels are bearish. 3. Weekly stochastic is overbought and close to rolling over. 4. Monthly stochastic is already bearish and not yet in oversold mode. 5. The weekly and monthly charts confirm a completed double-top pattern. The bottom line here is simply this — MAT has made a significantly bearish trend reversal and looks to have plenty more downside ground to cover before it can manage a truly strong recovery. Based on simple Fibonacci swing ratio calculations, the next major support area for MAT is somewhere between 26.00 and 29.00, with the price zone near the top end of that range appearing to offer the most solid amount of chart support for the stock. |
|
| Figure 2. MAT's weekly chart paints a bleak intermediate term picture for buy and hold investors who are still long this stock. |
| Graphic provided by: KnowVera Research LLC. |
| |
| Playing MAT here on the short side is simple enough: 1. MAT's daily stochastic has already made a bearish crossover; to ensure the move south has sufficient force however, wait until the lowest low of the previous five trading sessions is taken out (37.99) and then go short MAT with confidence, knowing that you have three major time frames in the stock in complete agreement as to a high probability of further weakness ahead for the stock. 2. The initial stop should be between 39.50 and 40.00 and a three-bar trailing stop of the daily highs can be used to manage the trade. 3. Once the 35.00 area is reached, consider taking partial profits and maintain your trailing stop. 4. If all other trend indicators mentioned are still negative then, try to hold on for an even bigger ride down toward the 29.00/30.00 major support area mentioned. Keep your account risk at one to two percent and remember to trade and invest wisely until we meet here again. |
Freelance financial markets writer and online publisher of the Trendzetterz.com S&P 500 Weekly Forecast service.
| Title: | Market consultant and writer |
| Company: | Trendzetterz |
| Address: | 81 Hickory Hollow Drive |
| Crossville, TN 38555 | |
| Phone # for sales: | 904-303-4814 |
| Website: | trendzetterz.com |
| E-mail address: | support@trendzetterz.com |
Traders' Resource Links | |
| Trendzetterz has not added any product or service information to TRADERS' RESOURCE. | |
Click here for more information about our publications!
PRINT THIS ARTICLE

Request Information From Our Sponsors
- StockCharts.com, Inc.
- Candle Patterns
- Candlestick Charting Explained
- Intermarket Technical Analysis
- John Murphy on Chart Analysis
- John Murphy's Chart Pattern Recognition
- John Murphy's Market Message
- MurphyExplainsMarketAnalysis-Intermarket Analysis
- MurphyExplainsMarketAnalysis-Visual Analysis
- StockCharts.com
- Technical Analysis of the Financial Markets
- The Visual Investor
- VectorVest, Inc.
- Executive Premier Workshop
- One-Day Options Course
- OptionsPro
- Retirement Income Workshop
- Sure-Fire Trading Systems (VectorVest, Inc.)
- Trading as a Business Workshop
- VectorVest 7 EOD
- VectorVest 7 RealTime/IntraDay
- VectorVest AutoTester
- VectorVest Educational Services
- VectorVest OnLine
- VectorVest Options Analyzer
- VectorVest ProGraphics v6.0
- VectorVest ProTrader 7
- VectorVest RealTime Derby Tool
- VectorVest Simulator
- VectorVest Variator
- VectorVest Watchdog