

HOT TOPICS LIST
- MACD
- Fibonacci
- RSI
- Gann
- ADXR
- Stochastics
- Volume
- Triangles
- Futures
- Cycles
- Volatility
- ZIGZAG
- MESA
- Retracement
- Aroon
INDICATORS LIST
LIST OF TOPICS
PRINT THIS ARTICLE
by Donald W. Pendergast, Jr.
After completing a five-wave Elliott sequence, shares of Facebook are still seeking support.
Position: N/A
Donald W. Pendergast, Jr.
Freelance financial markets writer and online publisher of the Trendzetterz.com S&P 500 Weekly Forecast service.
PRINT THIS ARTICLE
FIBONACCI
Facebook: Corrective Wave Patterns
03/26/14 03:46:58 PMby Donald W. Pendergast, Jr.
After completing a five-wave Elliott sequence, shares of Facebook are still seeking support.
Position: N/A
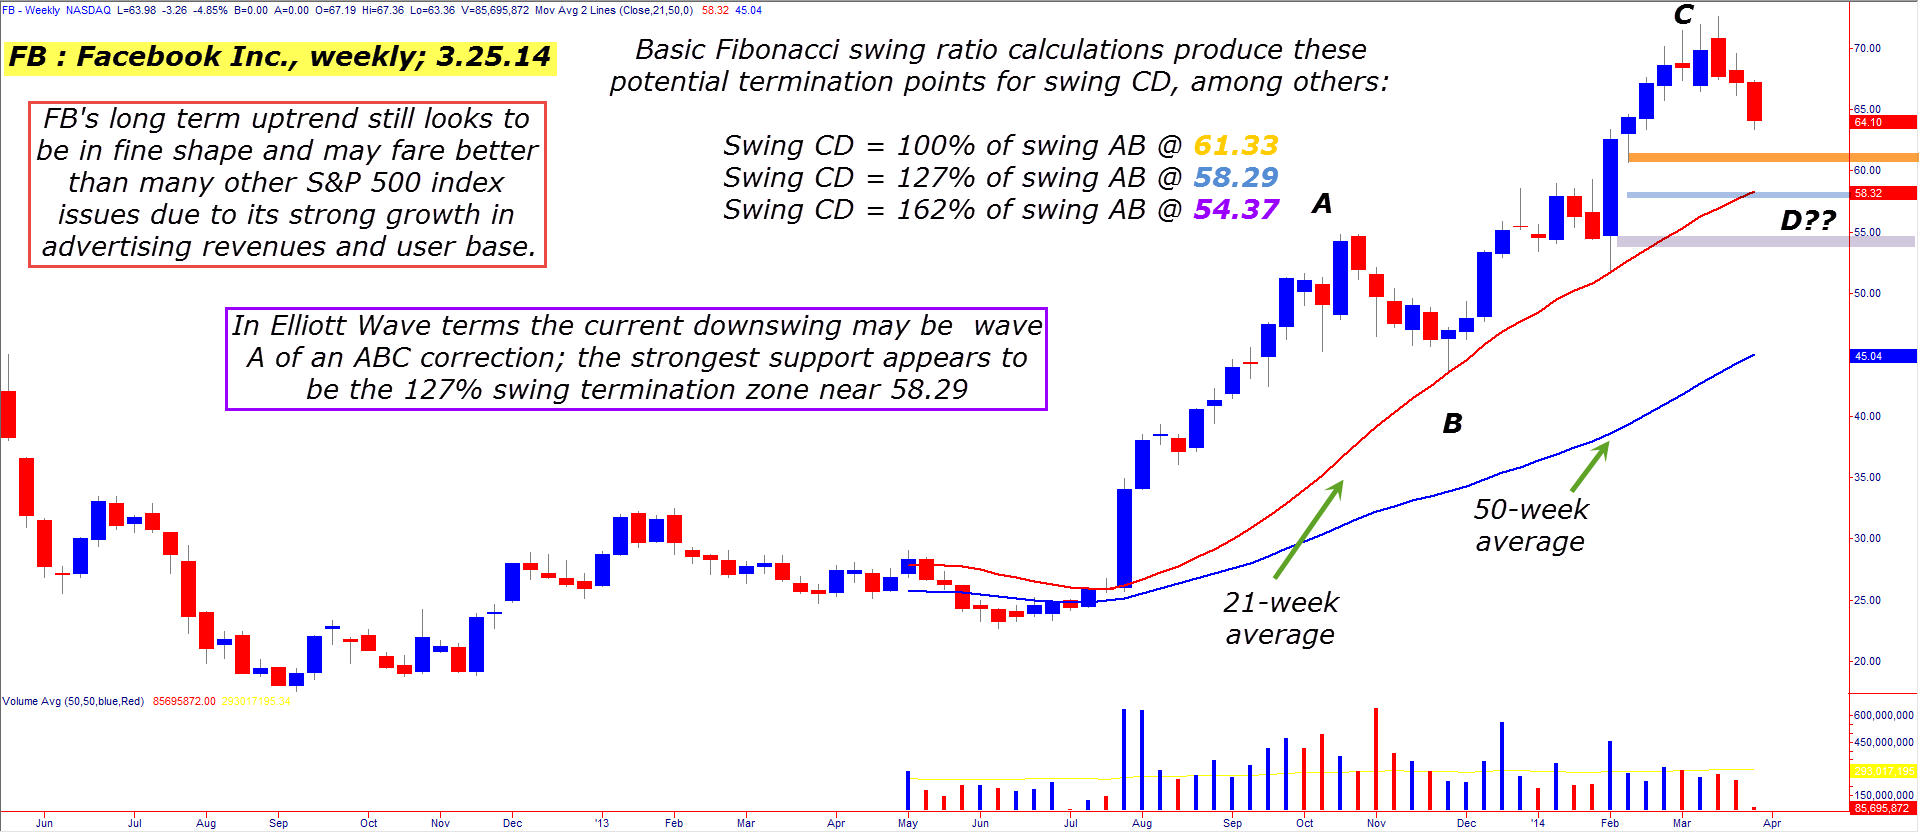
| Facebook (FB) has been a publicly-traded company for less than two years, but that was plenty of time for a beautiful, bullish Elliott Wave pattern to play out; the stock was caught in a slightly bearish/sideways funk for the first 14 months of trading action after its IPO, after which it caught fire and soared higher from mid-July 2013 to mid-March 2014. Now, however, FB is in the midst of an ongoing — and substantial — correction, one that may turn out to be proportional to the length of its aforementioned rally. Here's a closer look. |
|
| Figure 1. Facebook Inc. (FB) may see swing CD terminate at any one of the three price levels shown on the chart; all are based on Fibonacci swing ratios. |
| Graphic provided by: TradeStation. |
| |
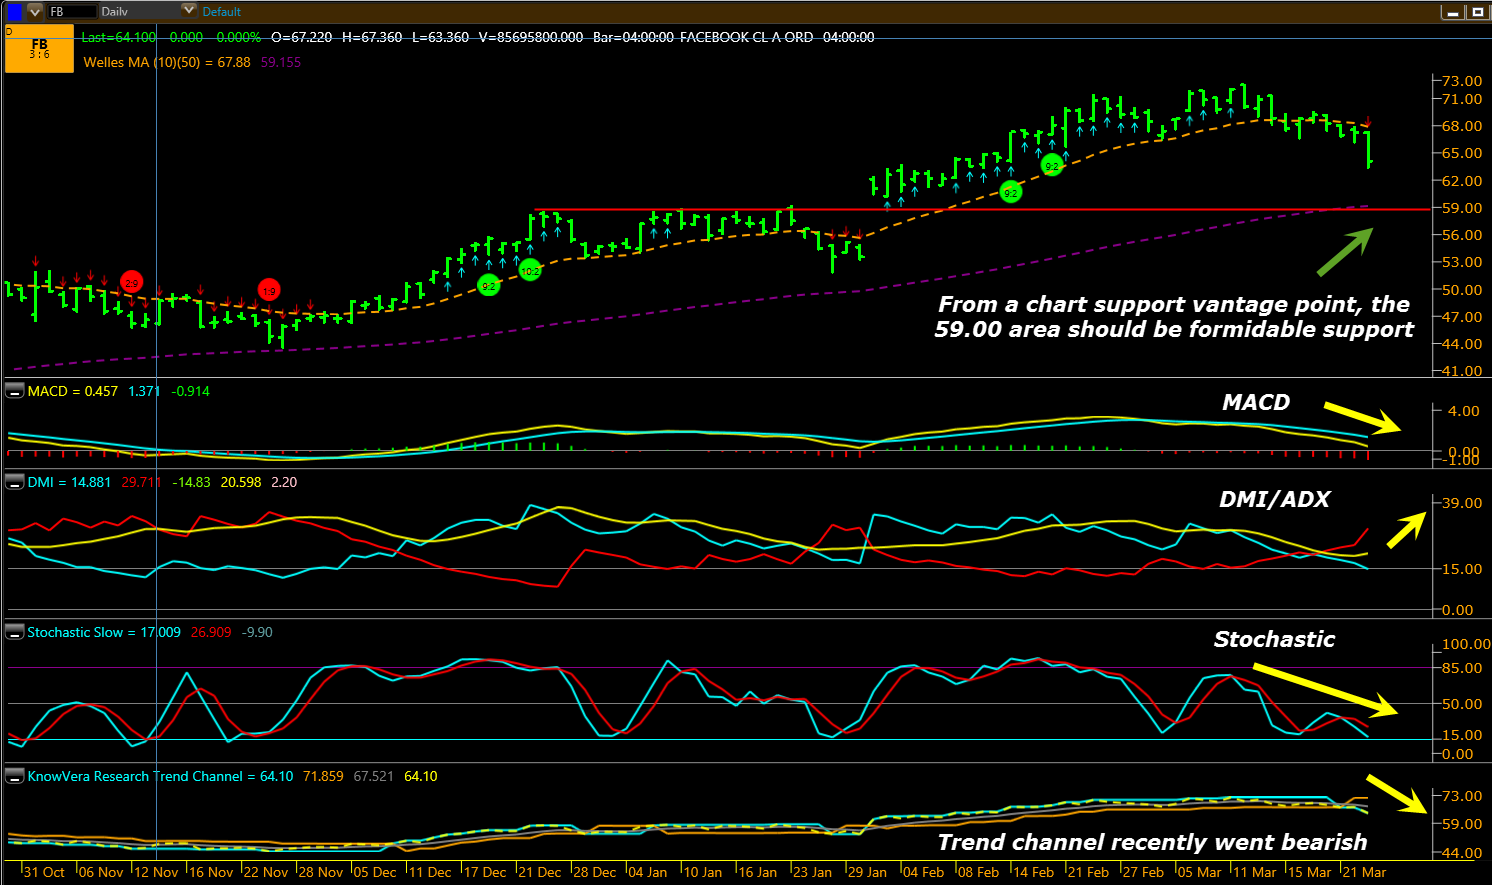
| FB's rally was incredible — running from a low of 22.67 all the way up to 72.59 in the span of eight months — which for a large cap is more than impressive. Sharp chart watchers already knew that the final rally phase (wave 5) had less "smart money" participation (the eventual death-knell for any long advance) and that it was only a matter of time until FB peaked and began a proportional correction; the correction is in full-bore mode now and here's the basic rundown of the bearish technicals involved: 1. FB's weekly chart has a strongly bearish stochastic indicator (Figure 1). 2. The weekly MACD has just made a bearish crossover. 3. On the daily chart in Figure 2, FB's trend channel has recently made a negative turn. 4. The daily MACD is heavily bearish, as is the daily stochastic and DMI/ADX combo; in fact the daily chart's downtrend is getting stronger every day. So, there are beau coup negative trend dynamics working hard to bring FB down to its next major set of price support levels; you can see three of them on the chart and each one coincides with key Fibonacci swing ratio termination points for swing CD, as follows: Swing CD = 100% of swing AB @ 61.33 Swing CD = 127% of swing AB @ 58.29 Swing CD = 162% of swing AB @ 54.37 These are useful swing projection ratios (.62, .79, 2.00 and 2.33 are also numbers to watch for on shorter or longer CD swings) and give a trader a rational basis to calculate swing termination zones on any freely traded market. |
|
| Figure 2. FB's daily chart dynamics are downright nasty looking, with heavy bearish momentum in every direction. Nevertheless, a major support level resides near 59.00. |
| Graphic provided by: KnowVera Research LLC. |
| |
| Note that the middle swing termination (127%) price of 58.29 closely coincides with strong chart support near 59.00; this could be an area in which to expect some serious short covering in the next few weeks as the A-wave decline plays out, so if you are currently short FB, be sure you begin covering before the stock hits that level. FB has huge institutional following and the giant mutual funds will be looking to score a deal on a heavily discounted FB once it hits 58.00 to 60.00. In fact, that price zone may very well launch the wave B part of the ABC corrective pattern and could be good for anywhere from a $4 to $7 bounce before it exhausts and the killer bear wave C commences sometime later in the first half of 2014. How you choose to play FB here is up to you, but at least you now have the advantage of knowing where wave A (same as swing CD) may find serious big money buyer intervention, thus saving you lost short trade profits even as it can help you prepare for some kind of a B-wave bounce up ahead. Trade wisely until we meet here again. |
Freelance financial markets writer and online publisher of the Trendzetterz.com S&P 500 Weekly Forecast service.
| Title: | Market consultant and writer |
| Company: | Trendzetterz |
| Address: | 81 Hickory Hollow Drive |
| Crossville, TN 38555 | |
| Phone # for sales: | 904-303-4814 |
| Website: | trendzetterz.com |
| E-mail address: | support@trendzetterz.com |
Traders' Resource Links | |
| Trendzetterz has not added any product or service information to TRADERS' RESOURCE. | |
Click here for more information about our publications!
Comments
Date:�03/28/14Rank:�5Comment:�

Request Information From Our Sponsors
- StockCharts.com, Inc.
- Candle Patterns
- Candlestick Charting Explained
- Intermarket Technical Analysis
- John Murphy on Chart Analysis
- John Murphy's Chart Pattern Recognition
- John Murphy's Market Message
- MurphyExplainsMarketAnalysis-Intermarket Analysis
- MurphyExplainsMarketAnalysis-Visual Analysis
- StockCharts.com
- Technical Analysis of the Financial Markets
- The Visual Investor
- VectorVest, Inc.
- Executive Premier Workshop
- One-Day Options Course
- OptionsPro
- Retirement Income Workshop
- Sure-Fire Trading Systems (VectorVest, Inc.)
- Trading as a Business Workshop
- VectorVest 7 EOD
- VectorVest 7 RealTime/IntraDay
- VectorVest AutoTester
- VectorVest Educational Services
- VectorVest OnLine
- VectorVest Options Analyzer
- VectorVest ProGraphics v6.0
- VectorVest ProTrader 7
- VectorVest RealTime Derby Tool
- VectorVest Simulator
- VectorVest Variator
- VectorVest Watchdog