HOT TOPICS LIST
- MACD
- Fibonacci
- RSI
- Gann
- ADXR
- Stochastics
- Volume
- Triangles
- Futures
- Cycles
- Volatility
- ZIGZAG
- MESA
- Retracement
- Aroon
INDICATORS LIST
LIST OF TOPICS
PRINT THIS ARTICLE
by Donald W. Pendergast, Jr.
Shares of Baxter International have been in corrective mode since peaking in July 2013 and look to be continuing on a downward trajectory.
Position: N/A
Donald W. Pendergast, Jr.
Freelance financial markets writer and online publisher of the Trendzetterz.com S&P 500 Weekly Forecast service.
PRINT THIS ARTICLE
TREND-CHANNEL
BAX: Bearish Momentum
03/25/14 04:05:48 PMby Donald W. Pendergast, Jr.
Shares of Baxter International have been in corrective mode since peaking in July 2013 and look to be continuing on a downward trajectory.
Position: N/A
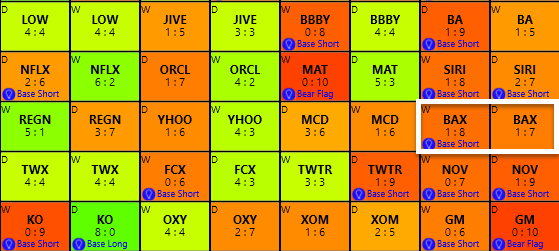
| As corrections go, the slow decline in shares of Baxter International (BAX) since the last week of July 2013 has been fairly tepid; however, its daily, weekly, and monthly chart series suggests that this large cap healthcare issue may only be halfway through with its correction — one that could last well into the second half of 2014. Here's a closer look. |

|
| Figure 1. Baxter International's (BAX) daily and weekly trend scores easily qualify as bearish; the stock also has a bearish MACD indicator on its monthly chart. |
| Graphic provided by: KnowVera Research LLC. |
| |
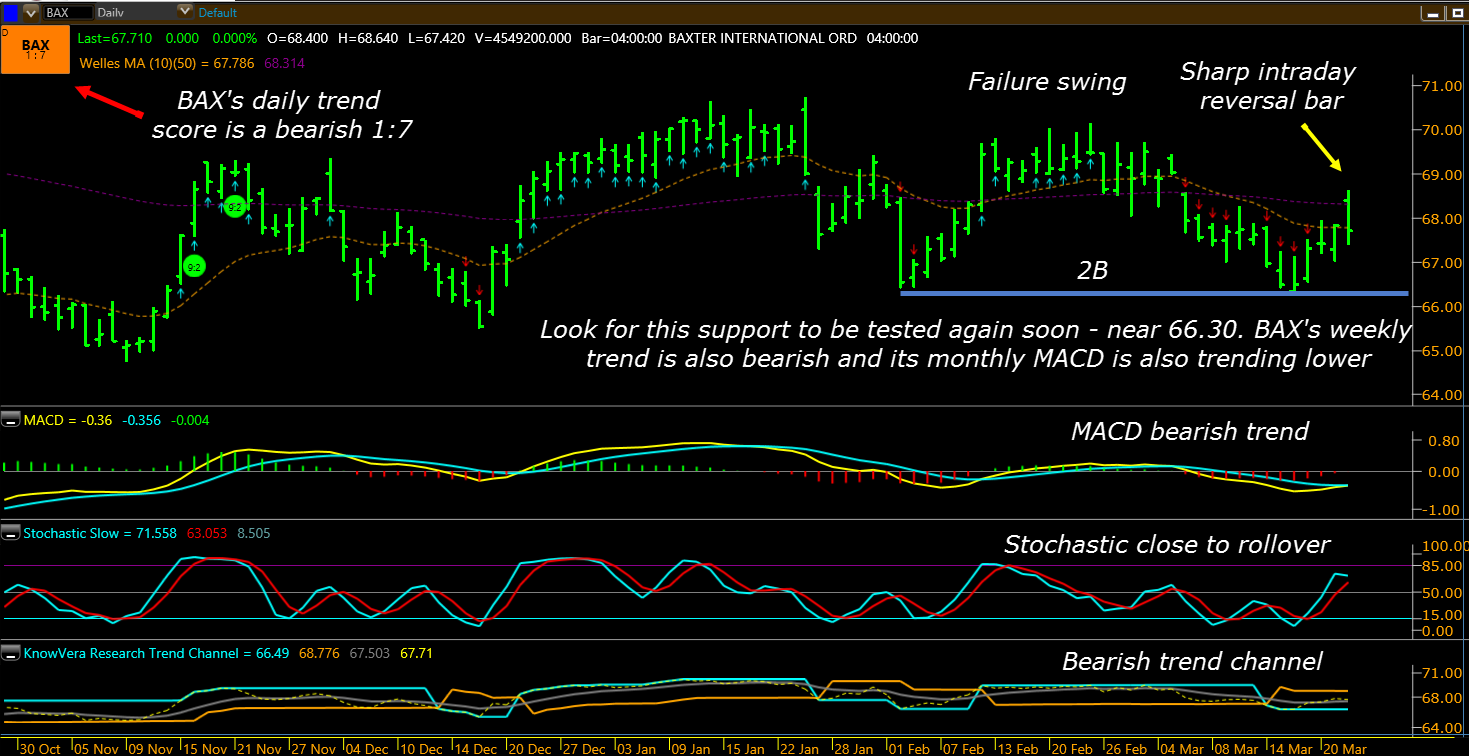
| BAX isn't a super aggressive, high volatility stock, but is instead rather sluggish and in some ways more predictable in its price action than many of its mid- and small-cap brethren in the healthcare sector. BAX has heavy institutional ownership and there is typically a lot of stop-and-reverse price action near major support/resistance areas and for that reason we'll look at an interesting — and potentially low risk — short swing trade setup here. First off, here are the main technical dynamics at work in driving BAX toward lower prices: 1. Its monthly chart is manifesting a decidedly bearish MACD pattern. 2. On its weekly chart, BAX is showing us bearish MACD, stochastic, DMI (directional movement index), and trend channel indicators. 3. On the daily time frame (Figure 2) BAX's chart reveals some valuable clues for skilled chart readers, namely, that the stock saw a "failure swing" in late February 2014, one that caused plenty of selling and resulted in a double bottom pattern. Now, its latest bullish swing has been abruptly terminated and BAX seems intent on testing key support near the 66.30 level (purple line). Remember, the weekly and monthly charts are showing substantially bearish momentum, so this is not the time to play superhero and buy BAX — at least not yet. However, once the stock hits that support area again, expect the "smart money" (mutual funds, big-money pro traders with info unavailable to riffraff like us retail traders) to step in and provide buying support for BAX. While there may not be a giant bounce higher from that level, the idea here is to alert current shorts in BAX that 66.30 or thereabouts would be an excellent place to buy to cover and go back to cash. |

|
| Figure 2. BAX stages a sharp intraday reversal on Friday, March 21, 2014. This stock has a high probability of retesting support near 66.30 in the near future. |
| Graphic provided by: KnowVera Research LLC. |
| |
| For those traders willing to go short here, the basic layout of the trade looks like this: 1. You want to keep the initial stop just above the 10-bar moving average — near 67.85. 2. You only want to enter on a drop below Friday's low of 66.34. If the stock gaps significantly lower, just pass on this trade — don't chase the price lower. 3. You also want to use the 66.30 support area as your logical price target. Put all of these prices together and you come up with a risk to reward ratio of about 2.5 to 1, which is outstanding for a swing trade with clearly defined target/stop parameters. Limit your account risk to 1% max on this trade and as soon as you see the big money move in to acquire BAX (even if above 66.30) be sure to pull the plug on the trade, cover, and go to cash before you get your lunch eaten for you. Trade wisely until we meet here again. |
Freelance financial markets writer and online publisher of the Trendzetterz.com S&P 500 Weekly Forecast service.
| Title: | Market consultant and writer |
| Company: | Trendzetterz |
| Address: | 81 Hickory Hollow Drive |
| Crossville, TN 38555 | |
| Phone # for sales: | 904-303-4814 |
| Website: | trendzetterz.com |
| E-mail address: | support@trendzetterz.com |
Traders' Resource Links | |
| Trendzetterz has not added any product or service information to TRADERS' RESOURCE. | |
Click here for more information about our publications!
PRINT THIS ARTICLE

Request Information From Our Sponsors
- StockCharts.com, Inc.
- Candle Patterns
- Candlestick Charting Explained
- Intermarket Technical Analysis
- John Murphy on Chart Analysis
- John Murphy's Chart Pattern Recognition
- John Murphy's Market Message
- MurphyExplainsMarketAnalysis-Intermarket Analysis
- MurphyExplainsMarketAnalysis-Visual Analysis
- StockCharts.com
- Technical Analysis of the Financial Markets
- The Visual Investor
- VectorVest, Inc.
- Executive Premier Workshop
- One-Day Options Course
- OptionsPro
- Retirement Income Workshop
- Sure-Fire Trading Systems (VectorVest, Inc.)
- Trading as a Business Workshop
- VectorVest 7 EOD
- VectorVest 7 RealTime/IntraDay
- VectorVest AutoTester
- VectorVest Educational Services
- VectorVest OnLine
- VectorVest Options Analyzer
- VectorVest ProGraphics v6.0
- VectorVest ProTrader 7
- VectorVest RealTime Derby Tool
- VectorVest Simulator
- VectorVest Variator
- VectorVest Watchdog
