HOT TOPICS LIST
- MACD
- Fibonacci
- RSI
- Gann
- ADXR
- Stochastics
- Volume
- Triangles
- Futures
- Cycles
- Volatility
- ZIGZAG
- MESA
- Retracement
- Aroon
INDICATORS LIST
LIST OF TOPICS
PRINT THIS ARTICLE
by David Penn
A breakout from a symmetrical triangle takes the 10-year Treasury into an ascending triangle.
Position: N/A
David Penn
Technical Writer for Technical Analysis of STOCKS & COMMODITIES magazine, Working-Money.com, and Traders.com Advantage.
PRINT THIS ARTICLE
TRIANGLES
Another Triangle in Treasuries
10/10/02 07:47:47 AMby David Penn
A breakout from a symmetrical triangle takes the 10-year Treasury into an ascending triangle.
Position: N/A
| Morgan Stanley chief economist Stephen Roach recently wrote a piece called "Don't Give up on Treasuries." His point, reached without any observable technical analysis clues, was that those who believed that the amazing rally in U.S. government bonds was coming to an end are being premature. His focus was both on the yield end (Roach believes the economy is on the verge of deflation) as well as on the price end (heavy buyers of Treasuries and money market funds that own Treasuries). Roach is among those who've referred to the ongoing rally in Treasuries a "melt-up." |
| However, there is ample technical support for a continued rally in Treasuries. Most recently, I noted a symmetrical triangle in the 10-year Treasury note ("The Triangle in Treasuries", Traders.com Advantage, 9/3/02) that looked to send the September T-note (TYU2) from just over 113 to 116. Now, with the December T-note closing in on 116 (reached first during intraday trading on October 8th), there is reason to believe that Treasuries may be headed even higher. |

|
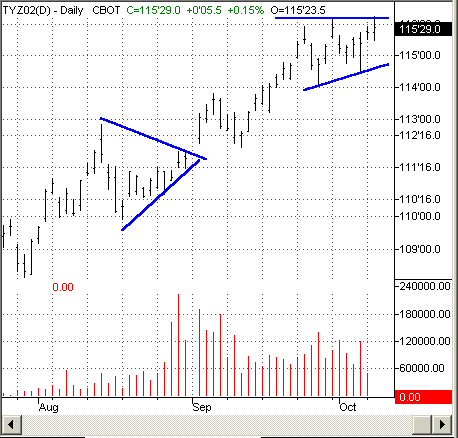
| The breakout from a symmetrical triangle in September leads to a potential ascending triangle in October. |
| Graphic provided by: TradeStation. |
| |
| The December 10-year T-note's ascending triangle consists of a horizontal resistance level at about 116, and a higher low at 114 at the end of September and a somewhat higher low in mid-October. Triangles, as I noted in "Triangles and the British Pound" (Traders.com Advantage, 10/7/02), put price action in what is often referred to as a "coiled spring" from which prices often emerge dramatically. In descending triangles, this emergence or break is typically on the downside, as repeated tests finally force the support level to give way. In ascending triangles such as the one developing in the December 10-year Treasury, the break is commonly to the upside. |
| Taking the formation size of the December ascending triangle into account, TYZ2 looks capable of moving as high as 118 in an initial move. This is derived from adding the formation size--approximately two points--to the value at the level of horizontal resistance. For those interested in the yield end of the Treasury equation, an advance to 118 would likely send 10-year Treasury yields even closer to the so-called 3% threshold. |
Technical Writer for Technical Analysis of STOCKS & COMMODITIES magazine, Working-Money.com, and Traders.com Advantage.
| Title: | Technical Writer |
| Company: | Technical Analysis, Inc. |
| Address: | 4757 California Avenue SW |
| Seattle, WA 98116 | |
| Phone # for sales: | 206 938 0570 |
| Fax: | 206 938 1307 |
| Website: | www.Traders.com |
| E-mail address: | DPenn@traders.com |
Traders' Resource Links | |
| Charting the Stock Market: The Wyckoff Method -- Books | |
| Working-Money.com -- Online Trading Services | |
| Traders.com Advantage -- Online Trading Services | |
| Technical Analysis of Stocks & Commodities -- Publications and Newsletters | |
| Working Money, at Working-Money.com -- Publications and Newsletters | |
| Traders.com Advantage -- Publications and Newsletters | |
| Professional Traders Starter Kit -- Software | |
Click here for more information about our publications!
Comments
Date: 10/11/02Rank: 5Comment:

Request Information From Our Sponsors
- StockCharts.com, Inc.
- Candle Patterns
- Candlestick Charting Explained
- Intermarket Technical Analysis
- John Murphy on Chart Analysis
- John Murphy's Chart Pattern Recognition
- John Murphy's Market Message
- MurphyExplainsMarketAnalysis-Intermarket Analysis
- MurphyExplainsMarketAnalysis-Visual Analysis
- StockCharts.com
- Technical Analysis of the Financial Markets
- The Visual Investor
- VectorVest, Inc.
- Executive Premier Workshop
- One-Day Options Course
- OptionsPro
- Retirement Income Workshop
- Sure-Fire Trading Systems (VectorVest, Inc.)
- Trading as a Business Workshop
- VectorVest 7 EOD
- VectorVest 7 RealTime/IntraDay
- VectorVest AutoTester
- VectorVest Educational Services
- VectorVest OnLine
- VectorVest Options Analyzer
- VectorVest ProGraphics v6.0
- VectorVest ProTrader 7
- VectorVest RealTime Derby Tool
- VectorVest Simulator
- VectorVest Variator
- VectorVest Watchdog
