

HOT TOPICS LIST
- MACD
- Fibonacci
- RSI
- Gann
- ADXR
- Stochastics
- Volume
- Triangles
- Futures
- Cycles
- Volatility
- ZIGZAG
- MESA
- Retracement
- Aroon
INDICATORS LIST
LIST OF TOPICS
PRINT THIS ARTICLE
by Matt Blackman
In Q1-2104, biotech companies are up nearly 15% YTD. But they were up nearly 35%. What happened?
Position: N/A
Matt Blackman
Matt Blackman is a full-time technical and financial writer and trader. He produces corporate and financial newsletters, and assists clients in getting published in the mainstream media. He is the host of TradeSystemGuru.com. Matt has earned the Chartered Market Technician (CMT) designation. Find out what stocks and futures Matt is watching on Twitter at www.twitter.com/RatioTrade
PRINT THIS ARTICLE
TECHNICAL ANALYSIS
What's (Not) Up With Biotechs?
03/26/14 03:39:56 PMby Matt Blackman
In Q1-2104, biotech companies are up nearly 15% YTD. But they were up nearly 35%. What happened?
Position: N/A
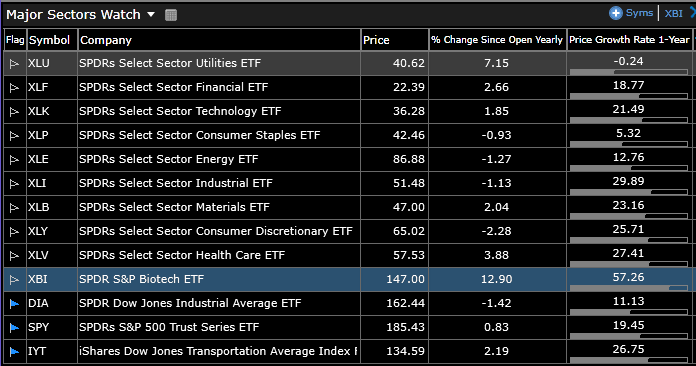
| Between bottoming in March 2009 and the end of February 2014, the SPDRs S&P Biotech ETF (XBI) gained an incredible 300% compared to a gain of approximately 180% for the SPDRs S&P500 Trust ETF (SPY). As you see from Figure 1, Biotechs have far outperformed the major sector ETFs both YTD and over the last year. |
|
| Figure 1. Table comparing the performance of the major sector ETFs YTD and over the last year. |
| Graphic provided by: TC2000.com. |
| |
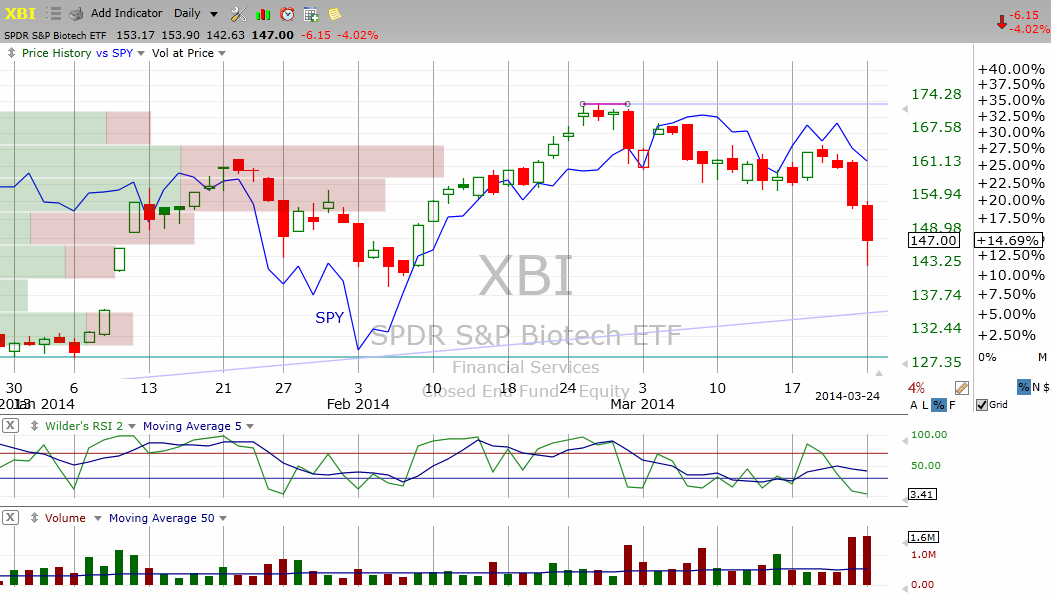
| And until the end of February, the biotech picture looked a lot stronger with the sector having gained nearly 35% since January 1. Since late February, the NASDAQ Biotech Index has dropped 10% and XBI gains have been cut in half. What happened? |
|
| Figure 2. Daily chart showing year-to-date gains for XBI compared to the SPY (blue). |
| Graphic provided by: TC2000.com. |
| |
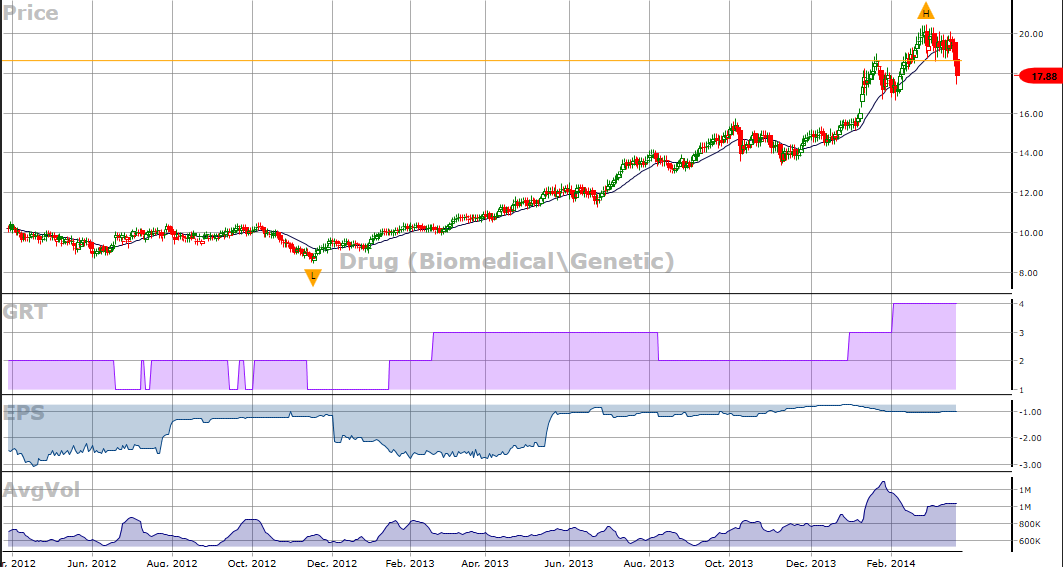
| In an attempt to answer that question, I looked at earnings and growth to see if the profit picture for Biotechs has changed substantially. Figure 3 shows that the one- to three-year forecasted growth rate (GRT) rose to 4% in 2014. Forecasted earnings-per-share for the next 12 months hasn't changed much in the last year and is currently hovering around a loss of $0.88. |
|
| Figure 3. Daily chart of the drug (biomedical/generic) industry showing the combination of price/volume data with some key fundamental metrics. |
| Graphic provided by: http://www.VectorVest.com. |
| |
| One reason for the drop in stocks on March 24, 2014 was the more than 6% drop on the day by Alexion Pharmaceuticals (ALXN) which rattled investors given the strong lead biotechs have provided US stocks. Forecasted EPS for AXLN are an impressive $3.64 per share but the one- to three-year forecasted growth rate dropped in Q4-2013 from 26% to 22%. But as most traders know, price is the best leading indicator and we probably won't see broader fundamental problems to explain the price drops for a while. With no fundamental reason yet to explain the correction, the drop could simply be a much needed correction from overbought levels. |
| The same overbought claim could be made of markets in general. But given that Biotechs have been leading the market for the last 24 months, this correction could be an early warning of a similar move to follow in broader terms. |
Matt Blackman is a full-time technical and financial writer and trader. He produces corporate and financial newsletters, and assists clients in getting published in the mainstream media. He is the host of TradeSystemGuru.com. Matt has earned the Chartered Market Technician (CMT) designation. Find out what stocks and futures Matt is watching on Twitter at www.twitter.com/RatioTrade
| Company: | TradeSystemGuru.com |
| Address: | Box 2589 |
| Garibaldi Highlands, BC Canada | |
| Phone # for sales: | 604-898-9069 |
| Fax: | 604-898-9069 |
| Website: | www.tradesystemguru.com |
| E-mail address: | indextradermb@gmail.com |
Traders' Resource Links | |
| TradeSystemGuru.com has not added any product or service information to TRADERS' RESOURCE. | |
Click here for more information about our publications!
PRINT THIS ARTICLE

Request Information From Our Sponsors
- VectorVest, Inc.
- Executive Premier Workshop
- One-Day Options Course
- OptionsPro
- Retirement Income Workshop
- Sure-Fire Trading Systems (VectorVest, Inc.)
- Trading as a Business Workshop
- VectorVest 7 EOD
- VectorVest 7 RealTime/IntraDay
- VectorVest AutoTester
- VectorVest Educational Services
- VectorVest OnLine
- VectorVest Options Analyzer
- VectorVest ProGraphics v6.0
- VectorVest ProTrader 7
- VectorVest RealTime Derby Tool
- VectorVest Simulator
- VectorVest Variator
- VectorVest Watchdog
- StockCharts.com, Inc.
- Candle Patterns
- Candlestick Charting Explained
- Intermarket Technical Analysis
- John Murphy on Chart Analysis
- John Murphy's Chart Pattern Recognition
- John Murphy's Market Message
- MurphyExplainsMarketAnalysis-Intermarket Analysis
- MurphyExplainsMarketAnalysis-Visual Analysis
- StockCharts.com
- Technical Analysis of the Financial Markets
- The Visual Investor