

HOT TOPICS LIST
- MACD
- Fibonacci
- RSI
- Gann
- ADXR
- Stochastics
- Volume
- Triangles
- Futures
- Cycles
- Volatility
- ZIGZAG
- MESA
- Retracement
- Aroon
INDICATORS LIST
LIST OF TOPICS
PRINT THIS ARTICLE
by Koos van der Merwe
Hewlett Packard announced that they intend to produce a 3-D printer. Has this affected the share price of 3D Corporation?
Position: Hold
Koos van der Merwe
Has been a technical analyst since 1969, and has worked as a futures and options trader with First Financial Futures in Johannesburg, South Africa.
PRINT THIS ARTICLE
HEAD & SHOULDERS
Going With 3-D Printing
03/24/14 04:59:39 PMby Koos van der Merwe
Hewlett Packard announced that they intend to produce a 3-D printer. Has this affected the share price of 3D Corporation?
Position: Hold
| "HP's 3-D printing initiative is a serious blow to the bull thesis on 3D Systems. Competition is just starting to heat up. The situation is likely to get worse when Asian low-cost companies expand their distribution reach. 3D Systems' ASPs and gross margins are at risk and we expect additional EPS disappointments. Our bear-case valuation stands at $26." The above is the news that hit the screen this past week, and the share price of 3D Systems (DDD) fell strongly. Is this the end for DDD? What do the charts say? |
|
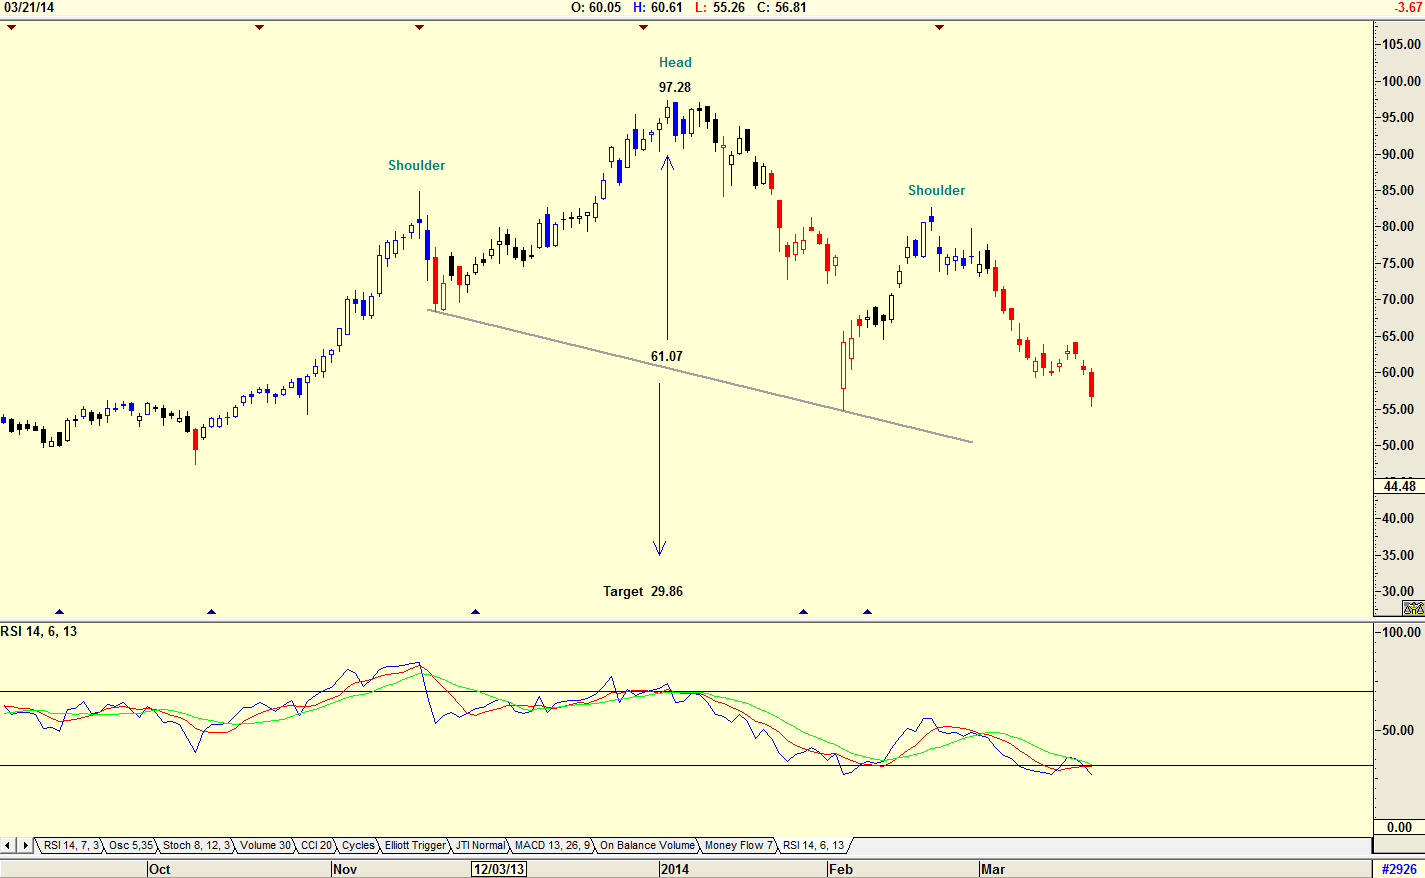
| Figure 1. Daily chart showing the head & shoulders pattern as suggested by Jim Cramer on CNBC. |
| Graphic provided by: AdvancedGET. |
| |
| In Figure 1 you see a daily chart with a head & shoulders pattern suggesting a target of $29.86 (97.28-61.07=36.21; 61.07-36.21=29.86). As Jim Cramer said on CNBC on March 20, 2014, "that is one big head & shoulders pattern," and big it is. Does this mean that the price of DDD is on its way down to $29.86? |
|
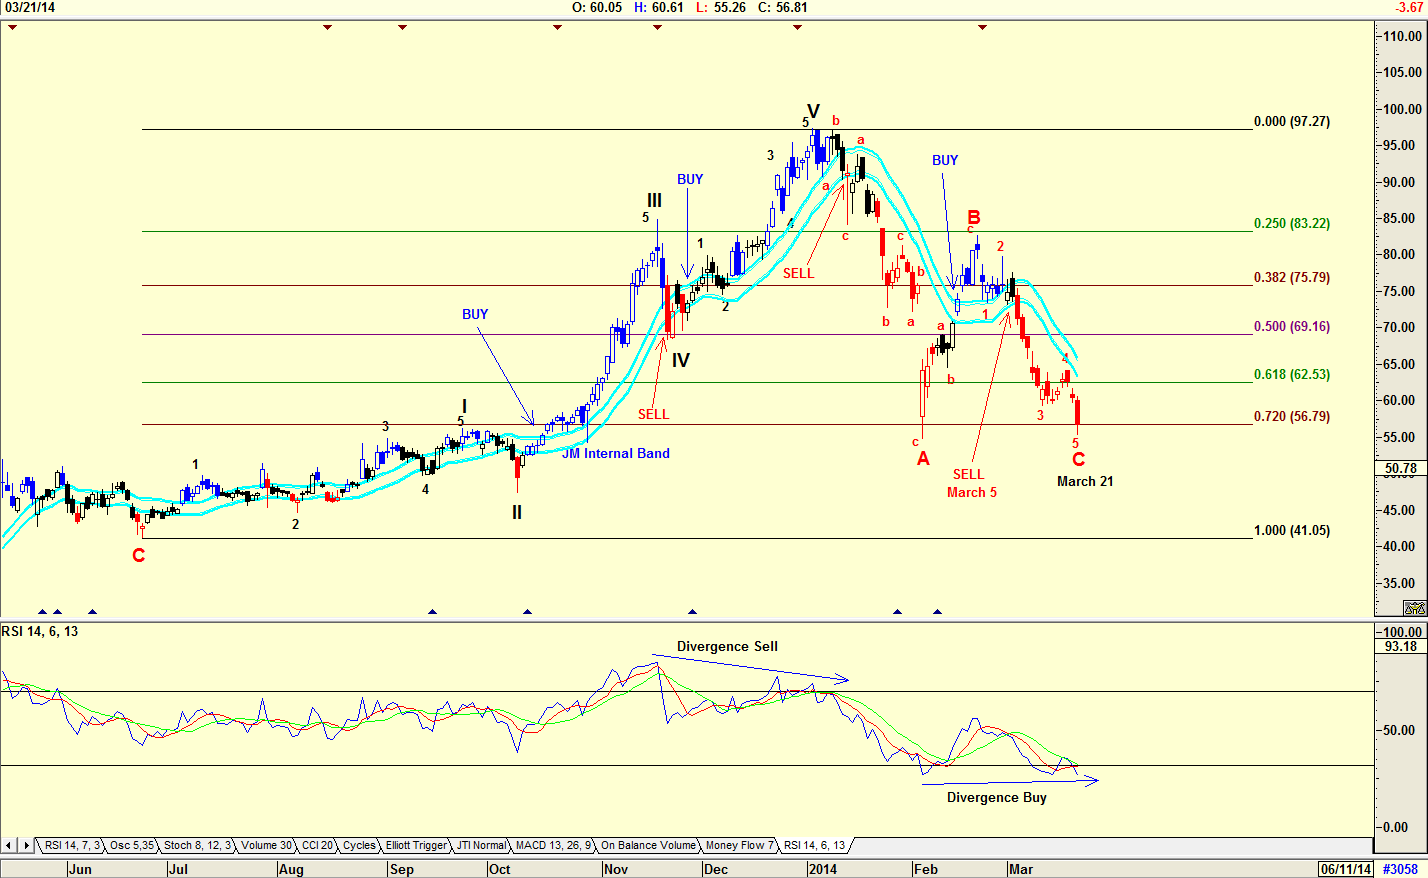
| Figure 2. Daily chart with Elliott Wave count suggesting a WAVE C bottom. |
| Graphic provided by: AdvancedGET. |
| |
| The chart in Figure 2 is a daily chart of DDD with an Elliott Wave count and a Fibonacci retracement count. The Elliott Wave count is suggesting that the C-Wave correction could be complete or close to completion. The Fibonacci retracement shows that the share price on March 21, 2014 closed at $56.81, the 72 retracement level. (The 72 is a half of the Fibonacci number 144). Note that the RSI indicator is suggesting a divergence buy signal. The chart also shows the JM Internal Band indicator, and that the share price gave a sell signal on March 5, 2014. The JM Internal Band indicator is a 15-period simple moving average offset by 2% positive and 2% negative. |
|
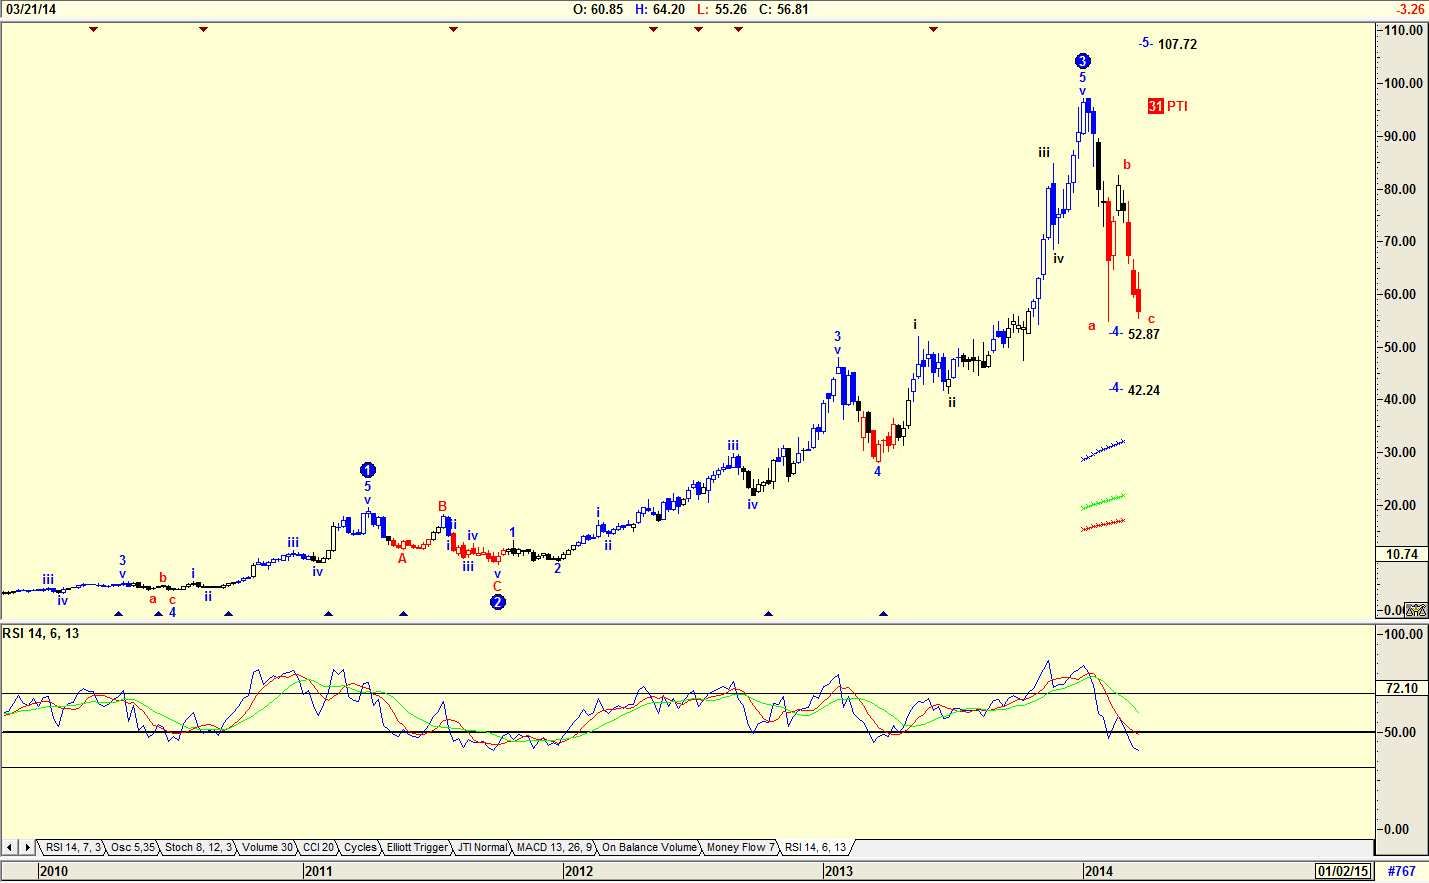
| Figure 3. Weekly chart suggesting a WAVE 4 bottom is possible. |
| Graphic provided by: AdvancedGET. |
| |
| The chart in Figure 3 is a weekly chart with an Elliott Wave count suggesting that the share price is completing a WAVE 4 correction. Do note the RSI history which gave a buy signal when it fell below the 50 level. Also note the WAVE 5 target of $107.72 with a probability index (PTI) of 31. The PTI is a bit low, but worth keeping in mind. The share price could, however, fall to the WAVE 4 projection of either $52.87 or $42.24 before rising. I would not be a buyer of DDD at the moment, but the charts are suggesting that a buy signal with a target of $107.72 could be given in the near future. The reason for this buy signal could be a number of things, from a takeover offer from another company, to a report of above expectation results. This is a share that should be watched. |
Has been a technical analyst since 1969, and has worked as a futures and options trader with First Financial Futures in Johannesburg, South Africa.
| Address: | 3256 West 24th Ave |
| Vancouver, BC | |
| Phone # for sales: | 6042634214 |
| E-mail address: | petroosp@gmail.com |
Click here for more information about our publications!
PRINT THIS ARTICLE

Request Information From Our Sponsors
- StockCharts.com, Inc.
- Candle Patterns
- Candlestick Charting Explained
- Intermarket Technical Analysis
- John Murphy on Chart Analysis
- John Murphy's Chart Pattern Recognition
- John Murphy's Market Message
- MurphyExplainsMarketAnalysis-Intermarket Analysis
- MurphyExplainsMarketAnalysis-Visual Analysis
- StockCharts.com
- Technical Analysis of the Financial Markets
- The Visual Investor
- VectorVest, Inc.
- Executive Premier Workshop
- One-Day Options Course
- OptionsPro
- Retirement Income Workshop
- Sure-Fire Trading Systems (VectorVest, Inc.)
- Trading as a Business Workshop
- VectorVest 7 EOD
- VectorVest 7 RealTime/IntraDay
- VectorVest AutoTester
- VectorVest Educational Services
- VectorVest OnLine
- VectorVest Options Analyzer
- VectorVest ProGraphics v6.0
- VectorVest ProTrader 7
- VectorVest RealTime Derby Tool
- VectorVest Simulator
- VectorVest Variator
- VectorVest Watchdog