

HOT TOPICS LIST
- MACD
- Fibonacci
- RSI
- Gann
- ADXR
- Stochastics
- Volume
- Triangles
- Futures
- Cycles
- Volatility
- ZIGZAG
- MESA
- Retracement
- Aroon
INDICATORS LIST
LIST OF TOPICS
PRINT THIS ARTICLE
by Matt Blackman
Hewlett Packard had a tough time from 2010 through early 2013 but since then it has shown steady gains. It's recently flashed an impressive bullish chart pattern that's worth examining.
Position: N/A
Matt Blackman
Matt Blackman is a full-time technical and financial writer and trader. He produces corporate and financial newsletters, and assists clients in getting published in the mainstream media. He is the host of TradeSystemGuru.com. Matt has earned the Chartered Market Technician (CMT) designation. Find out what stocks and futures Matt is watching on Twitter at www.twitter.com/RatioTrade
PRINT THIS ARTICLE
HEAD & SHOULDERS
The Hewlett Packard Rally - Is It Sustainable?
03/24/14 04:54:10 PMby Matt Blackman
Hewlett Packard had a tough time from 2010 through early 2013 but since then it has shown steady gains. It's recently flashed an impressive bullish chart pattern that's worth examining.
Position: N/A
| The transition away from personal computers into tablets and smart phones has been hard on a number of companies including the likes of computer hardware manufacturer Dell Computer and software maker Microsoft. Hewlett Packard (HPQ) has also struggled but there is evidence in its chart that the worst may be over. In late February 2014, the company reported that it had beaten Q1 sales and profit expectations as it has won new orders for servers in the ever important enterprise space. Under CEO Meg Whitman, HPQ has been engaged in a restructuring to cut costs and increase revenues. According to data from TC2000.com, she has made a valiant effort. HPQ has experienced earnings per share growth of 17% in the latest quarter and 142% in the latest year, although revenues have declined 5.6% in the last four quarters. |

|
| Figure 1 � Weekly chart showing the powerful inverse head & shoulders pattern that has been building since 2012 with a decisive break above the neckline in December 2013. |
| Graphic provided by: TC2000.com. |
| |
| In a March 21, 2014 Twitter post, Suri Duddella author of the book "Trade Chart Patterns Like the Pros," commented that HPQ was showing an inverse head & shoulders pattern (see Stocktwits.com post ). Upon closer examination, the pattern exhibited a downward sloping neckline with a minimum upside target of $43.68 (somewhat different than Suri's pattern) which is well above the $32 mark where the stock was trading. |
|
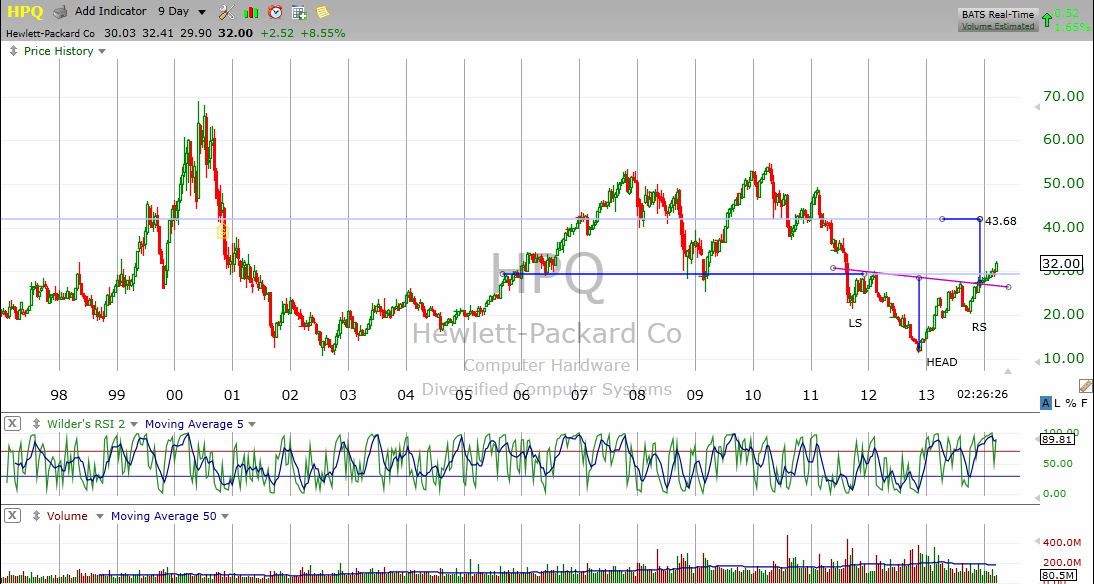
| Figure 2 � The nine-day chart of HPQ back to 1997 showing the all-time high for the stock in 2000 and double top chart pattern (2008 and 2010) followed by the 80% drop in the stock price before bottoming in late 2012. |
| Graphic provided by: TC2000.com. |
| |
| What the chart is saying to me is that although the personal computer space may be challenged, the same cannot be said for corporate enterprise demand. If you need further proof, check out computer software and services company Xerox (XRX) which has also been trending strongly since late 2012. Another company in that space, Oracle (ORCL), looks to be headed for a new all-time high. |
| As seen in Figure 2 with data going back to 1997, HPQ put in an all-time high in 2000, then a long-term double top pattern between 2008 and 2012. The current target would take the stock back to where it was trading in 2011 and so from a chart perspective is not out of the question. The two elephant-in-the-room caveats in this target are; 1) HPQ will have to transition top-line cuts into bottom-line growth and 2) markets and the economy will have to continue growing for it to be reached. |
Matt Blackman is a full-time technical and financial writer and trader. He produces corporate and financial newsletters, and assists clients in getting published in the mainstream media. He is the host of TradeSystemGuru.com. Matt has earned the Chartered Market Technician (CMT) designation. Find out what stocks and futures Matt is watching on Twitter at www.twitter.com/RatioTrade
| Company: | TradeSystemGuru.com |
| Address: | Box 2589 |
| Garibaldi Highlands, BC Canada | |
| Phone # for sales: | 604-898-9069 |
| Fax: | 604-898-9069 |
| Website: | www.tradesystemguru.com |
| E-mail address: | indextradermb@gmail.com |
Traders' Resource Links | |
| TradeSystemGuru.com has not added any product or service information to TRADERS' RESOURCE. | |
Click here for more information about our publications!
PRINT THIS ARTICLE

Request Information From Our Sponsors
- StockCharts.com, Inc.
- Candle Patterns
- Candlestick Charting Explained
- Intermarket Technical Analysis
- John Murphy on Chart Analysis
- John Murphy's Chart Pattern Recognition
- John Murphy's Market Message
- MurphyExplainsMarketAnalysis-Intermarket Analysis
- MurphyExplainsMarketAnalysis-Visual Analysis
- StockCharts.com
- Technical Analysis of the Financial Markets
- The Visual Investor
- VectorVest, Inc.
- Executive Premier Workshop
- One-Day Options Course
- OptionsPro
- Retirement Income Workshop
- Sure-Fire Trading Systems (VectorVest, Inc.)
- Trading as a Business Workshop
- VectorVest 7 EOD
- VectorVest 7 RealTime/IntraDay
- VectorVest AutoTester
- VectorVest Educational Services
- VectorVest OnLine
- VectorVest Options Analyzer
- VectorVest ProGraphics v6.0
- VectorVest ProTrader 7
- VectorVest RealTime Derby Tool
- VectorVest Simulator
- VectorVest Variator
- VectorVest Watchdog