HOT TOPICS LIST
- MACD
- Fibonacci
- RSI
- Gann
- ADXR
- Stochastics
- Volume
- Triangles
- Futures
- Cycles
- Volatility
- ZIGZAG
- MESA
- Retracement
- Aroon
INDICATORS LIST
LIST OF TOPICS
PRINT THIS ARTICLE
by Donald W. Pendergast, Jr.
Shares of Coca Cola stage a sudden, late session reversal on Wednesday March 19, 2014.
Position: N/A
Donald W. Pendergast, Jr.
Freelance financial markets writer and online publisher of the Trendzetterz.com S&P 500 Weekly Forecast service.
PRINT THIS ARTICLE
TREND-CHANNEL
Coca-Cola: Sharp Intraday Fizzle
03/21/14 03:14:44 PMby Donald W. Pendergast, Jr.
Shares of Coca Cola stage a sudden, late session reversal on Wednesday March 19, 2014.
Position: N/A
| Some intraday reversals are fakers, while others are the real thing — worth a closer look for active traders seeking short-term swing trading opportunities. Here's a look at the late session bearish reversal in one of the best known names in consumerdom — Coca-Cola — one that could be good for a quick short trade down toward a key support level. |

|
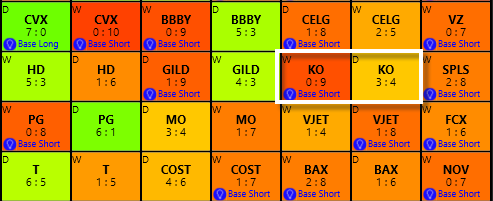
| Figure 1. Coca-Cola's (KO) weekly time frame is listed as a 'base short' with a very bearish trend score of 0:9. |
| Graphic provided by: KnowVera Research LLC. |
| |
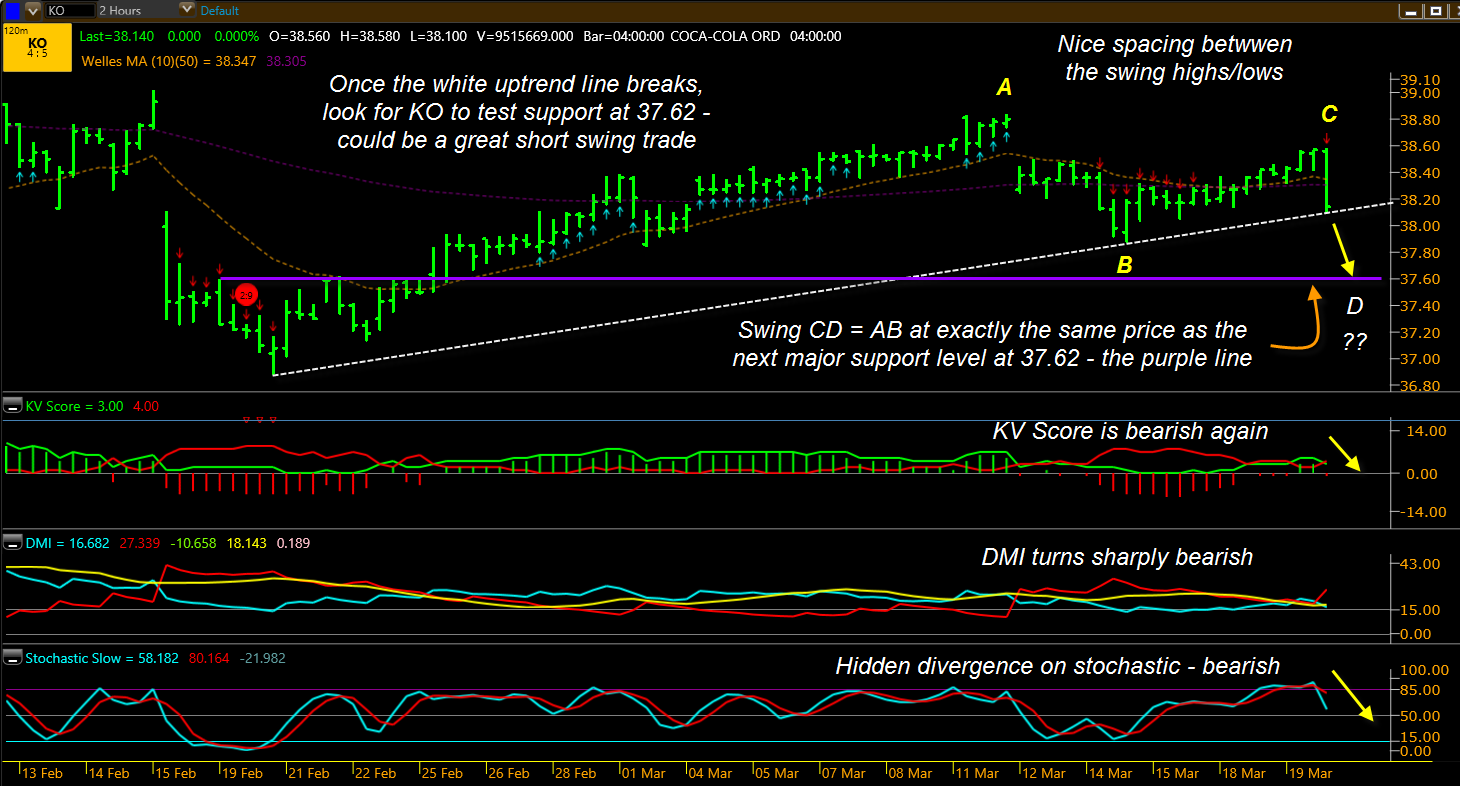
| Any company that has made trillions and trillions of dollars by creating, promoting and selling mass quantities of carbonated, sugar-laden beverages to the entire world has got to know a thing or two about the power of mass-media advertising and the draw of an instantly recognizable brand name and logo. The Coca Cola Company's initial roots date way back to the late 1800s when someone (riding a horse) with an unusual, caramel-colored medicinal remedy happened to sell his concoction to an Atlanta-area pharmacist... and as they say, the rest is history. Today, as a key Dow 30 component issue, Coca-Cola (KO) is also listed as a 'Consumer Staples' component of the SPDRs Select Sectors ETF complex (XLP), where it accounts for slightly less than 1% of the total weight in XLP. XLP is under performing the S&P 500 (.SPX, SPY) over the past 13 weeks, one of only two of the Select Sectors showing minor weakness. However, the beauty of owning stocks like KO and other high demand staples issues is that they have a fairly predictable stream of revenue, customers, and outlets that carry their products, making them more recession (depression) proof than stocks from more cyclical sectors like basic materials (XLB), technology (XLK), financials (XLF), consumer discretionary (XLY), and industrials (XLI). So any weakness described here for KO doesn't necessarily imply any major sell-off, although the stocks is looking weak across a variety of intraday time frames, along with its daily and weekly charts, too. The setup we see here on KO's 120-minute chart is a nearly picture-perfect AB=CD setup in process, and here's why: 1. The proportion of time/price spacing for the AB and CD swings is very balanced, especially in relation to the length of the prior advance. 2. The sharp reversal at point C reflects an abundance of supply of the stock available for sale at that price level, necessitating a drop in price to attract new buyers. 3. The white uptrend line may not be able to hold back the strength of such a sharp reversal; once broken, KO has a free path to run down toward the next major support level at 37.62 (purple line). 4. Interestingly, the support at 37.62 coincides perfectly with the fact that a move to that support level will mean that swing CD is 100% of the length of swing AB. Pros who use Fibonacci swing ratios will be watching that price zone carefully for signs that the "smart money" is ready to load up on KO again. By the way, if you short KO now, anywhere near 37.62 would be a great place to cover your short position, hopefully prior to a short-covering rally. 5. KO's weekly MACD is bearish and its stochastic indicator looks ready to roll over into bearish posture. 6. As mentioned before, KO is a component stock of XLP, which is lagging the .SPX over the last calendar quarter. |

|
| Figure 2. KO's 120-minute chart shows a powerful late session reversal bar on March 19, 2014, one that has taken it down to a key trend line. Look for stronger support near 37.62 to have more staying power, however. |
| Graphic provided by: KnowVera Research LLC. |
| |
| Playing KO on the short side is e-z: 1. Go short on a break below 38.10. 2. Place your initial stop just above the 10-bar average on the 120-minute chart (near 38.36) 3. Using the nominal price target of 37.62, the risk to reward ratio for this swing trade is approximately 1.79 to 1, which is excellent for such a short-term trade setup. 4. Keep your account risk at 1% (and preferably less) and by no means stay short beyond 37.62 with a full position; be sure to use a two to three-bar trailing stop of the 120-minute highs to manage your risk and lock in profits. Above all, trade wisely until we meet here again. |
Freelance financial markets writer and online publisher of the Trendzetterz.com S&P 500 Weekly Forecast service.
| Title: | Market consultant and writer |
| Company: | Trendzetterz |
| Address: | 81 Hickory Hollow Drive |
| Crossville, TN 38555 | |
| Phone # for sales: | 904-303-4814 |
| Website: | trendzetterz.com |
| E-mail address: | support@trendzetterz.com |
Traders' Resource Links | |
| Trendzetterz has not added any product or service information to TRADERS' RESOURCE. | |
Click here for more information about our publications!
Comments

Request Information From Our Sponsors
- StockCharts.com, Inc.
- Candle Patterns
- Candlestick Charting Explained
- Intermarket Technical Analysis
- John Murphy on Chart Analysis
- John Murphy's Chart Pattern Recognition
- John Murphy's Market Message
- MurphyExplainsMarketAnalysis-Intermarket Analysis
- MurphyExplainsMarketAnalysis-Visual Analysis
- StockCharts.com
- Technical Analysis of the Financial Markets
- The Visual Investor
- VectorVest, Inc.
- Executive Premier Workshop
- One-Day Options Course
- OptionsPro
- Retirement Income Workshop
- Sure-Fire Trading Systems (VectorVest, Inc.)
- Trading as a Business Workshop
- VectorVest 7 EOD
- VectorVest 7 RealTime/IntraDay
- VectorVest AutoTester
- VectorVest Educational Services
- VectorVest OnLine
- VectorVest Options Analyzer
- VectorVest ProGraphics v6.0
- VectorVest ProTrader 7
- VectorVest RealTime Derby Tool
- VectorVest Simulator
- VectorVest Variator
- VectorVest Watchdog
