HOT TOPICS LIST
- MACD
- Fibonacci
- RSI
- Gann
- ADXR
- Stochastics
- Volume
- Triangles
- Futures
- Cycles
- Volatility
- ZIGZAG
- MESA
- Retracement
- Aroon
INDICATORS LIST
LIST OF TOPICS
PRINT THIS ARTICLE
by Koos van der Merwe
When the price of a share rises logarithmically, do you simply buy?
Position: Buy
Koos van der Merwe
Has been a technical analyst since 1969, and has worked as a futures and options trader with First Financial Futures in Johannesburg, South Africa.
PRINT THIS ARTICLE
ELLIOTT WAVE
Perrigo Consumer Healthcare
03/18/14 04:58:30 PMby Koos van der Merwe
When the price of a share rises logarithmically, do you simply buy?
Position: Buy
| With the start of the Affordable Care Act in the United States, many who in the past could not afford medical insurance, now can. Medical companies and those that supply medical treatment and medicines — prescription or over-the-counter — can only benefit, possibly one of the reasons Perrigo has done so well. |

|
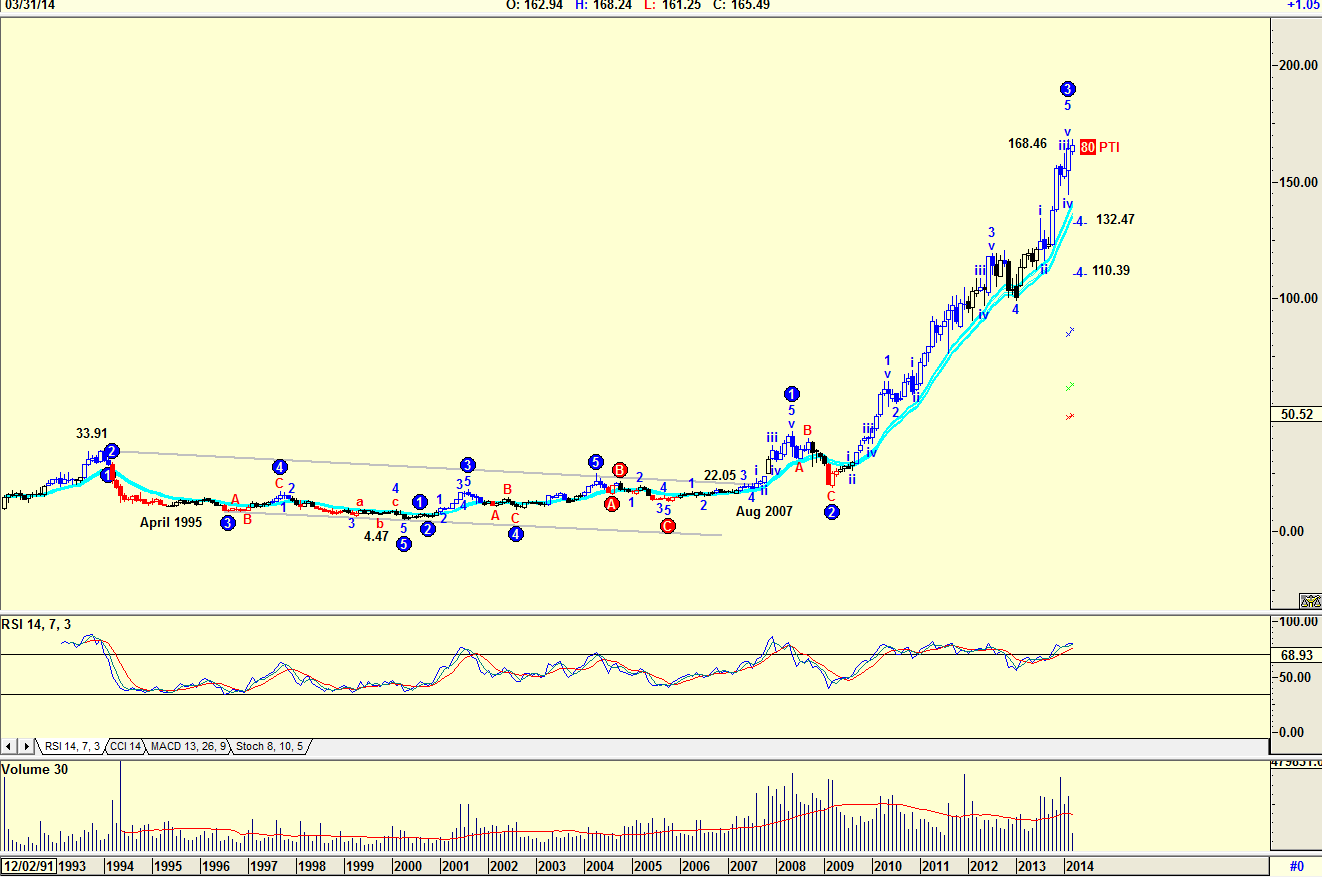
| Figure 1. Monthly chart showing an Elliott Wave count. |
| Graphic provided by: AdvancedGET. |
| |
| The chart in Figure 1 is a monthly chart that shows how the share price traded sideways from April 1995 to August 2007 in the range $4.47 to $33.91. Then the share price started to take off, breaking above the resistance line at $22.05. The chart is suggesting an 80% probability (PTI 80) that the share price could now fall from its high of $168.46 in a WAVE 4 correction to either $132.97 or $110.39. The RSI indicator is at overbought levels, but history has shown that this has not been that effective an indicator in calling a reversal. Volume did strengthen as the share price rose suggesting strength. |

|
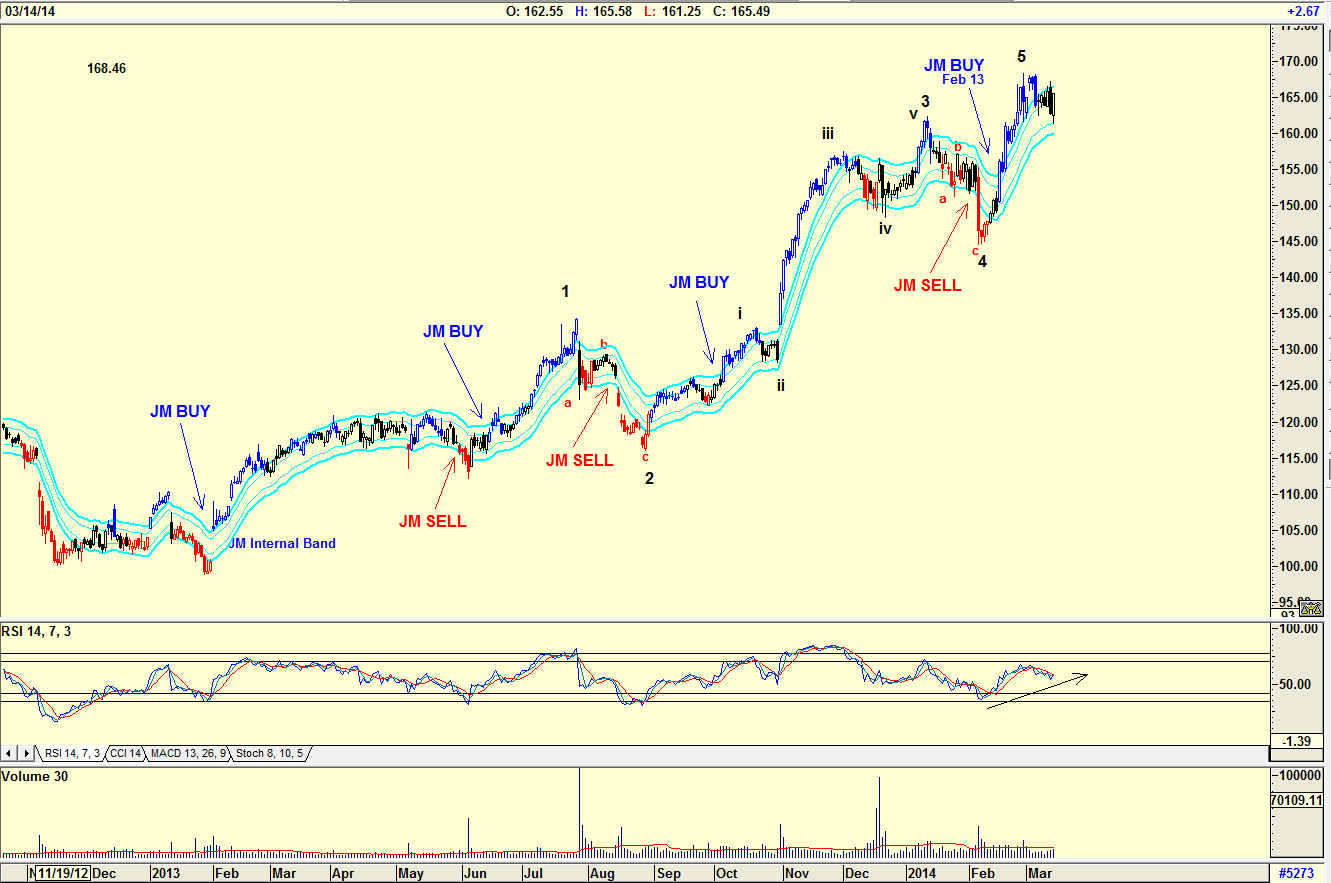
| Figure 2. Daily chart with an Elliott Wave count. |
| Graphic provided by: AdvancedGET. |
| |
| The chart in Figure 2 is a daily chart with an Elliott Wave count suggesting that the share price is in a WAVE 5. The share price gave a JM Internal band buy signal on February 13, 2014 and the price rose strongly. The JM Internal band is a 15-period simple moving average offset by 2% positive and 2% negative. A move above the upper band suggests a buy and a move below the lower band, a sell. Note that the RSI indicator is still in a positive trend. Finally, also note that the volume is below average for the last few negative trades. This is bullish. |

|
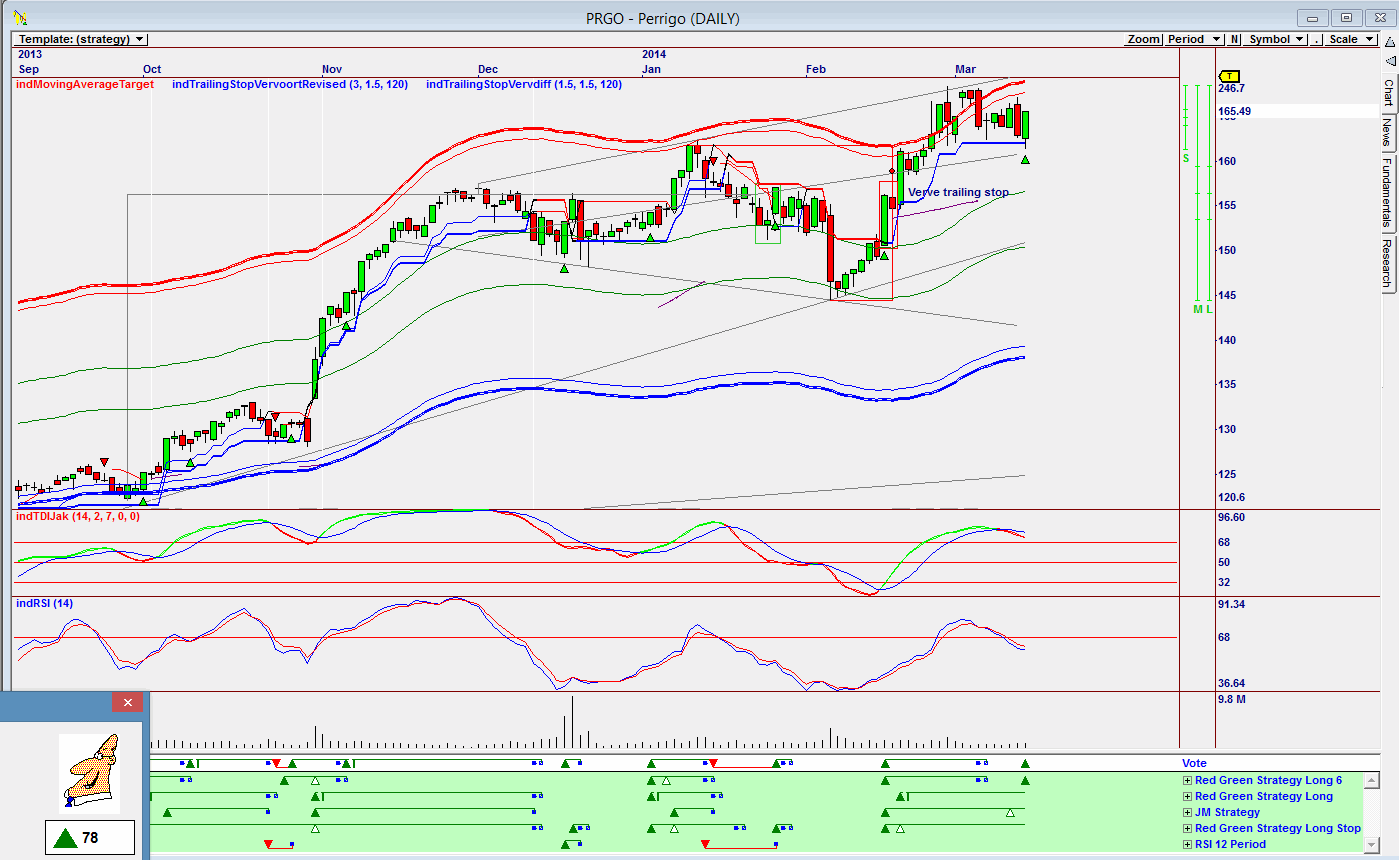
| Figure 3. Daily Omnitrader chart with Vote line showing a buy. |
| Graphic provided by: Omnitrader. |
| |
| The chart in Figure 3 is an Omnitrader chart showing a new buy signal given on Friday March 14, 2014. A buy signal given on the Vote line is a summation of the trading strategies shown in green below the Vote line. Note the Advisor rating of 78, which is a strong rating. One negative is that the share price is trading close to the upper exterior band. Finally, the IndTDIJak is suggesting weakness, and the RSI Indicator is also showing weakness. I would be a buyer of the share at current levels, but I would keep my stops close. |
Has been a technical analyst since 1969, and has worked as a futures and options trader with First Financial Futures in Johannesburg, South Africa.
| Address: | 3256 West 24th Ave |
| Vancouver, BC | |
| Phone # for sales: | 6042634214 |
| E-mail address: | petroosp@gmail.com |
Click here for more information about our publications!
PRINT THIS ARTICLE

Request Information From Our Sponsors
- VectorVest, Inc.
- Executive Premier Workshop
- One-Day Options Course
- OptionsPro
- Retirement Income Workshop
- Sure-Fire Trading Systems (VectorVest, Inc.)
- Trading as a Business Workshop
- VectorVest 7 EOD
- VectorVest 7 RealTime/IntraDay
- VectorVest AutoTester
- VectorVest Educational Services
- VectorVest OnLine
- VectorVest Options Analyzer
- VectorVest ProGraphics v6.0
- VectorVest ProTrader 7
- VectorVest RealTime Derby Tool
- VectorVest Simulator
- VectorVest Variator
- VectorVest Watchdog
- StockCharts.com, Inc.
- Candle Patterns
- Candlestick Charting Explained
- Intermarket Technical Analysis
- John Murphy on Chart Analysis
- John Murphy's Chart Pattern Recognition
- John Murphy's Market Message
- MurphyExplainsMarketAnalysis-Intermarket Analysis
- MurphyExplainsMarketAnalysis-Visual Analysis
- StockCharts.com
- Technical Analysis of the Financial Markets
- The Visual Investor
