HOT TOPICS LIST
- MACD
- Fibonacci
- RSI
- Gann
- ADXR
- Stochastics
- Volume
- Triangles
- Futures
- Cycles
- Volatility
- ZIGZAG
- MESA
- Retracement
- Aroon
INDICATORS LIST
LIST OF TOPICS
PRINT THIS ARTICLE
by Koos van der Merwe
When a symmetrical triangle pattern appears, and the share price breaks out, do you buy?
Position: Accumulate
Koos van der Merwe
Has been a technical analyst since 1969, and has worked as a futures and options trader with First Financial Futures in Johannesburg, South Africa.
PRINT THIS ARTICLE
TRIANGLES
Buying That Triangle
03/17/14 04:32:00 PMby Koos van der Merwe
When a symmetrical triangle pattern appears, and the share price breaks out, do you buy?
Position: Accumulate
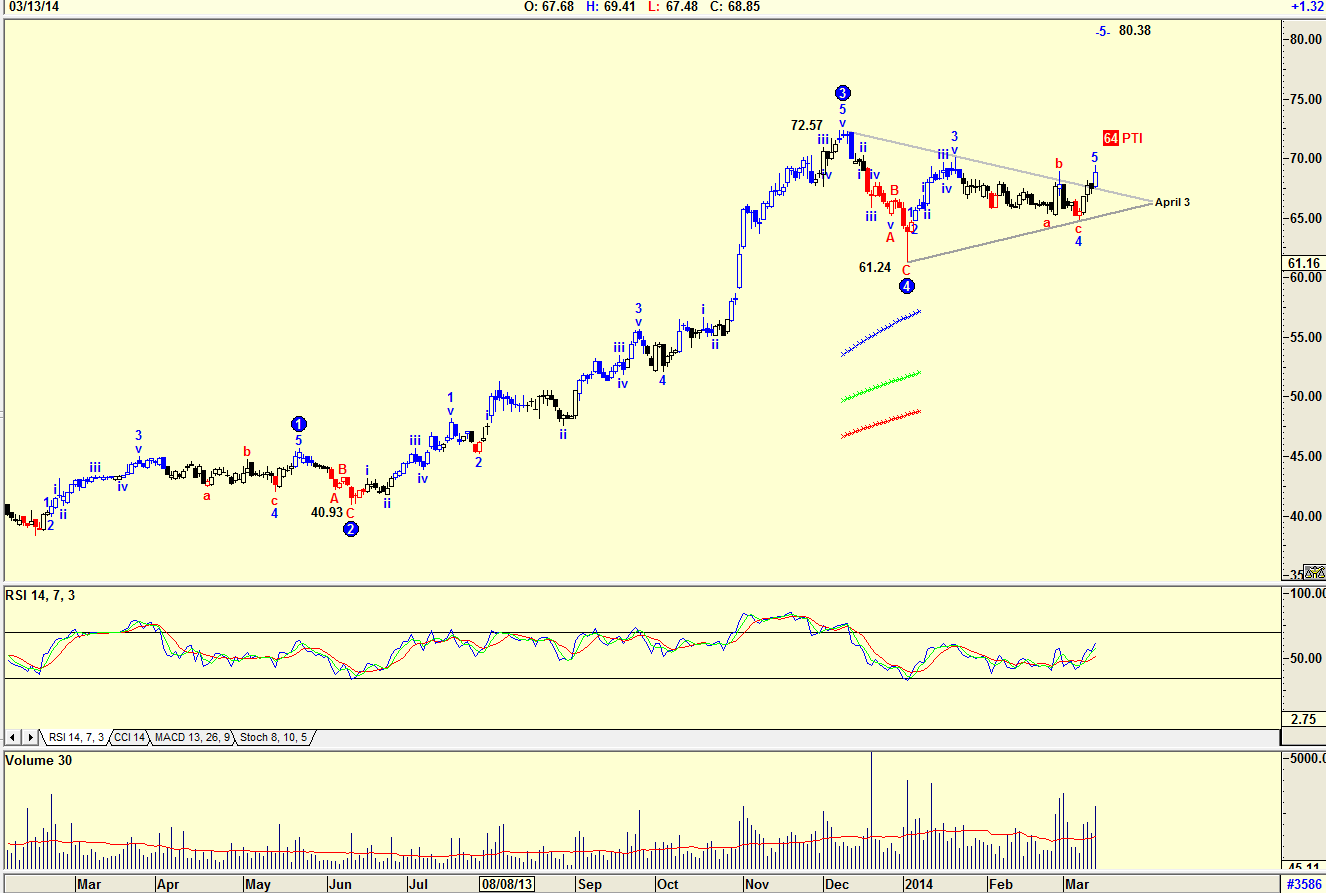
| A symmetrical triangle is formed by a succession of price fluctuations each of which is smaller than its predecessor. By definition, it must have at least four reversal points after which a breakout may occur at any time in the triangle, before the apex is reached. The apex gives you an approximate time that the target suggested by the triangle should be reached. A breakout to the upside should be on a high volume. If volume is light, a false move could occur. Does that mean that when prices trace a symmetrical triangle such as the one in the chart of Stantec Inc. (STN-T) in Figure 1, you should buy shares? |

|
| Figure 1. Daily chart showing symmetrical triangle and Elliott wave count with target. |
| Graphic provided by: AdvancedGET. |
| |
| The daily chart in Figure 1 displays the symmetrical triangle that has formed. The triangle is suggesting that the share price could rise to $104.21 (72.57 - 40.93 = 31.64 + 72.57 = 104.21) by April 3, 2014. This is a strong move which seems unlikely to be reached by April 3, 2014 but you can never tell. The Elliott wave count on the chart is suggesting a WAVE 5 target of $80.38 which seems far more likely. With the RSI trending upward, and with rising volume as the price rises, the share looks like a strong buy. Do note the PTI (Probability Index) which at 64 is strong, suggesting that the price should reach $80.38. |

|
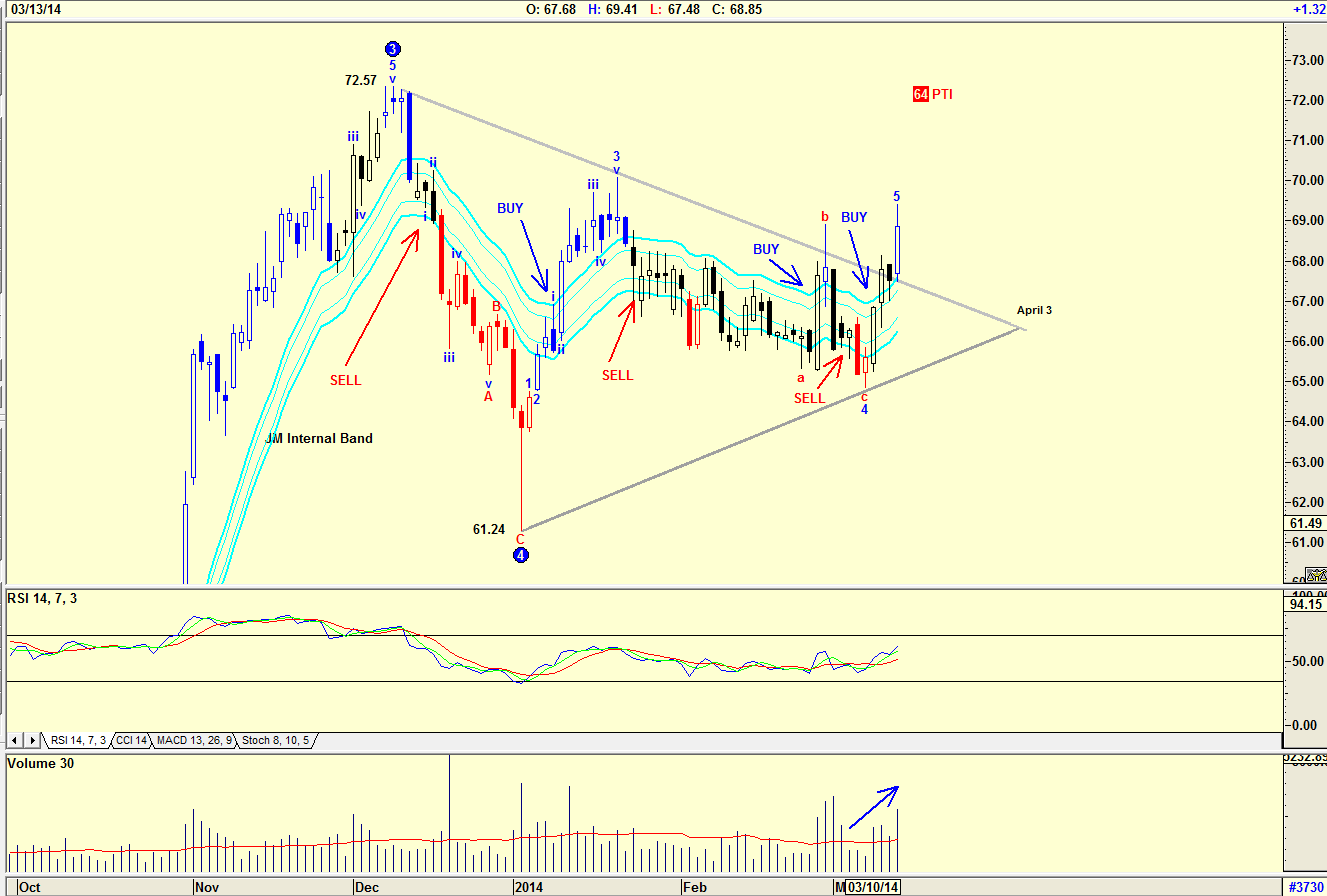
| Figure 2. Daily chart showing the symmetrical triangle pattern and the JM Internal Band indicator. |
| Graphic provided by: AdvancedGET. |
| |
| The daily chart in Figure 2 shows the symmetrical triangle, and the JM Internal Band indicator. The JM Internal Band indicator is a simple 15-period moving average offset by 2% positive and 2% negative. A break above the upper band suggests a buy signal and a move below the lower band is a sell signal, as shown on the chart. The chart shows that three days ago, the JM Internal Band indicator gave a buy signal, as the price broke out of the triangle. After studying the two charts, I would be a buyer of Stantec Inc. on any correction, should one occur. |
Has been a technical analyst since 1969, and has worked as a futures and options trader with First Financial Futures in Johannesburg, South Africa.
| Address: | 3256 West 24th Ave |
| Vancouver, BC | |
| Phone # for sales: | 6042634214 |
| E-mail address: | petroosp@gmail.com |
Click here for more information about our publications!
Comments

|

Request Information From Our Sponsors
- StockCharts.com, Inc.
- Candle Patterns
- Candlestick Charting Explained
- Intermarket Technical Analysis
- John Murphy on Chart Analysis
- John Murphy's Chart Pattern Recognition
- John Murphy's Market Message
- MurphyExplainsMarketAnalysis-Intermarket Analysis
- MurphyExplainsMarketAnalysis-Visual Analysis
- StockCharts.com
- Technical Analysis of the Financial Markets
- The Visual Investor
- VectorVest, Inc.
- Executive Premier Workshop
- One-Day Options Course
- OptionsPro
- Retirement Income Workshop
- Sure-Fire Trading Systems (VectorVest, Inc.)
- Trading as a Business Workshop
- VectorVest 7 EOD
- VectorVest 7 RealTime/IntraDay
- VectorVest AutoTester
- VectorVest Educational Services
- VectorVest OnLine
- VectorVest Options Analyzer
- VectorVest ProGraphics v6.0
- VectorVest ProTrader 7
- VectorVest RealTime Derby Tool
- VectorVest Simulator
- VectorVest Variator
- VectorVest Watchdog
