HOT TOPICS LIST
- MACD
- Fibonacci
- RSI
- Gann
- ADXR
- Stochastics
- Volume
- Triangles
- Futures
- Cycles
- Volatility
- ZIGZAG
- MESA
- Retracement
- Aroon
INDICATORS LIST
LIST OF TOPICS
PRINT THIS ARTICLE
by David Penn
Penny-wise and pound-foolish? Not if these triangles have anything to say about it.
Position: N/A
David Penn
Technical Writer for Technical Analysis of STOCKS & COMMODITIES magazine, Working-Money.com, and Traders.com Advantage.
PRINT THIS ARTICLE
TRIANGLES
Triangles and the British Pound
10/07/02 12:01:31 PMby David Penn
Penny-wise and pound-foolish? Not if these triangles have anything to say about it.
Position: N/A
| There has been much talk in "fundamental" circles about the way that the European Growth and Stability Pact has limited the ability of Eurozone governments to, among other things, use deficit spending to stimulate economic growth. Whether deficits should be part of a tax-cutting strategy or part of a government job-creation strategy, the fact is that neither strategy has much room for success under the Eurozone stability plan that ostensibly keeps the treasuries of its constituent members "honest." |
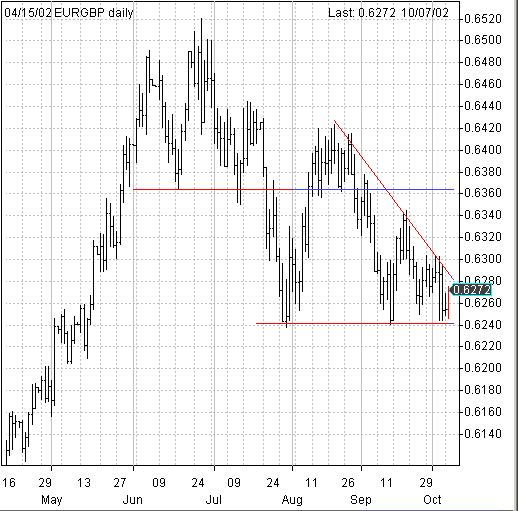
| One of the places the limiting effect of the stability pact increasingly may be seen is in the exchange rate between the euro and the British pound, represented in the forex markets as the EUR/GBP cross. While the euro spent the first half of 2002 appreciating against the pound, that appreciation seems to have peaked in late June. Since that time the euro, which remains highly valued relative to the dollar, has fallen significantly against the pound, dropping from a high of 0.6520 in late June to lows of 0.6240 in repeated tests of support in July, August and September. |

|
| A large, descending triangle suggests support at 0.6240. |
| Graphic provided by: FXCM Java Charts. |
| |
| EUR/GBP appears to have developed a large, descending triangle that ranges from the peak in August to the support tests mentioned above. This formation is characterized by the horizontal support and the steadily lower highs shown in the chart in Figure 1. Although often found in downtrends, descending triangles can also appear as tops or reversals in uptrends. Many have noted that often what begins as a head and shoulders top will deteriorate into a descending triangle-shaped top--typically because of a particularly weak head and right shoulder. The EUR/GBP presented here, however, is closer to a classic descending triangle. It is especially interesting how this descending triangle emerges from the wake of the head and shoulders top. The head and shoulders top developed over the June-July period and its breakout target of 0.6200 was barely missed in the first break to the downside in late July. The rally from the July low did move back up through the neckline of the June/July head and shoulders top (likely to the consternation of thse EUR/GBP shorts who did not take their profits very early in August). But after a few weeks of consolidation, EUR/GBP began moving back down, retesting the support at 0.6240. |
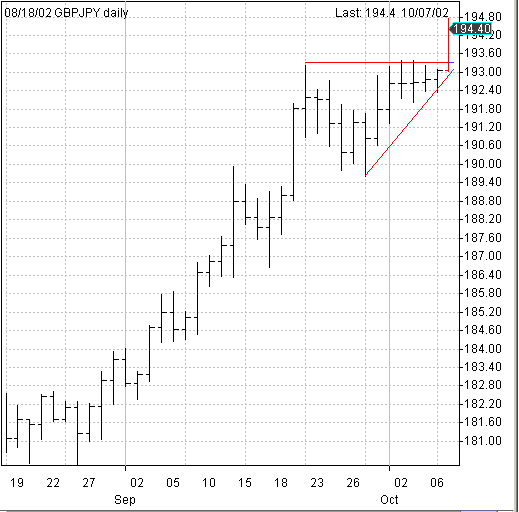
 This ascending triangle in GBP/JPY suggests more upside ahead. Additional evidence for pound bulls comes in the GBP/JPY cross, which similarly features a triangle. The triangle in this case is a smaller ascending triangle, suggesting that the pound will continue to appreciate against the Japanese yen--at least in the short-term. This ascending triangle is more in its "native habitat" than the larger, descending triangle in EUR/GBP. Here, the horizontal trendline represents resistance as higher lows mark an uptrend that is still in effect. Ascending triangles produce to the upside what descending triangles produce to the downside: a "coiled spring" effect that, when resistance or support is broken, can result in dramatic price moves. |
| What sort of prices might EUR/GBP and GBP/JPY reach should their respective triangles break as anticipated? The smaller GBP/JPY triangle is approximately 3.60 points in size which, when added to the value at the horizontal resistance level of 193.60 gives an upside target of 197.20. This would represent a new, year-to-date high for GBP/JPY. The picture for EUR/GBP is similarly bullish for the pound. Measuring the descending triangle from the August peak provides for a triangle size of 180, which suggests a downside target of 0.6060--a year-to-date low for EUR/GBP. |
Technical Writer for Technical Analysis of STOCKS & COMMODITIES magazine, Working-Money.com, and Traders.com Advantage.
| Title: | Technical Writer |
| Company: | Technical Analysis, Inc. |
| Address: | 4757 California Avenue SW |
| Seattle, WA 98116 | |
| Phone # for sales: | 206 938 0570 |
| Fax: | 206 938 1307 |
| Website: | www.Traders.com |
| E-mail address: | DPenn@traders.com |
Traders' Resource Links | |
| Charting the Stock Market: The Wyckoff Method -- Books | |
| Working-Money.com -- Online Trading Services | |
| Traders.com Advantage -- Online Trading Services | |
| Technical Analysis of Stocks & Commodities -- Publications and Newsletters | |
| Working Money, at Working-Money.com -- Publications and Newsletters | |
| Traders.com Advantage -- Publications and Newsletters | |
| Professional Traders Starter Kit -- Software | |
Click here for more information about our publications!
Comments
Date: 10/08/02Rank: 5Comment:

|

Request Information From Our Sponsors
- VectorVest, Inc.
- Executive Premier Workshop
- One-Day Options Course
- OptionsPro
- Retirement Income Workshop
- Sure-Fire Trading Systems (VectorVest, Inc.)
- Trading as a Business Workshop
- VectorVest 7 EOD
- VectorVest 7 RealTime/IntraDay
- VectorVest AutoTester
- VectorVest Educational Services
- VectorVest OnLine
- VectorVest Options Analyzer
- VectorVest ProGraphics v6.0
- VectorVest ProTrader 7
- VectorVest RealTime Derby Tool
- VectorVest Simulator
- VectorVest Variator
- VectorVest Watchdog
- StockCharts.com, Inc.
- Candle Patterns
- Candlestick Charting Explained
- Intermarket Technical Analysis
- John Murphy on Chart Analysis
- John Murphy's Chart Pattern Recognition
- John Murphy's Market Message
- MurphyExplainsMarketAnalysis-Intermarket Analysis
- MurphyExplainsMarketAnalysis-Visual Analysis
- StockCharts.com
- Technical Analysis of the Financial Markets
- The Visual Investor
