

HOT TOPICS LIST
- MACD
- Fibonacci
- RSI
- Gann
- ADXR
- Stochastics
- Volume
- Triangles
- Futures
- Cycles
- Volatility
- ZIGZAG
- MESA
- Retracement
- Aroon
INDICATORS LIST
LIST OF TOPICS
PRINT THIS ARTICLE
by Donald W. Pendergast, Jr.
Negative momentum on three of its key time frames suggests that shares of Vale S.A. may still have more downside as the second quarter of 2014 approaches.
Position: N/A
Donald W. Pendergast, Jr.
Freelance financial markets writer and online publisher of the Trendzetterz.com S&P 500 Weekly Forecast service.
PRINT THIS ARTICLE
SUPPORT & RESISTANCE
VALE: Testing Major Support
03/17/14 04:42:46 PMby Donald W. Pendergast, Jr.
Negative momentum on three of its key time frames suggests that shares of Vale S.A. may still have more downside as the second quarter of 2014 approaches.
Position: N/A
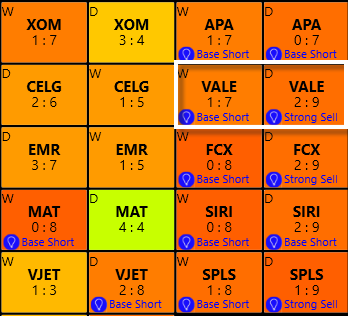
| Using two or three proportionaly-spaced time frames when doing chart analysis is a terrific way to line up your trades when the probabilities for success are the most favorable. Here's how to analyze the overall trend on a daily, weekly and monthly time frame, using a large cap South American mining stock that is still in a major long-term bear market. |
|
| Figure 1. Vale S.A. (VALE) has a potentially potent pair of bearish trend scores and rankings on its daily and weekly time frames. |
| Graphic provided by: KnowVera Research LLC. |
| |
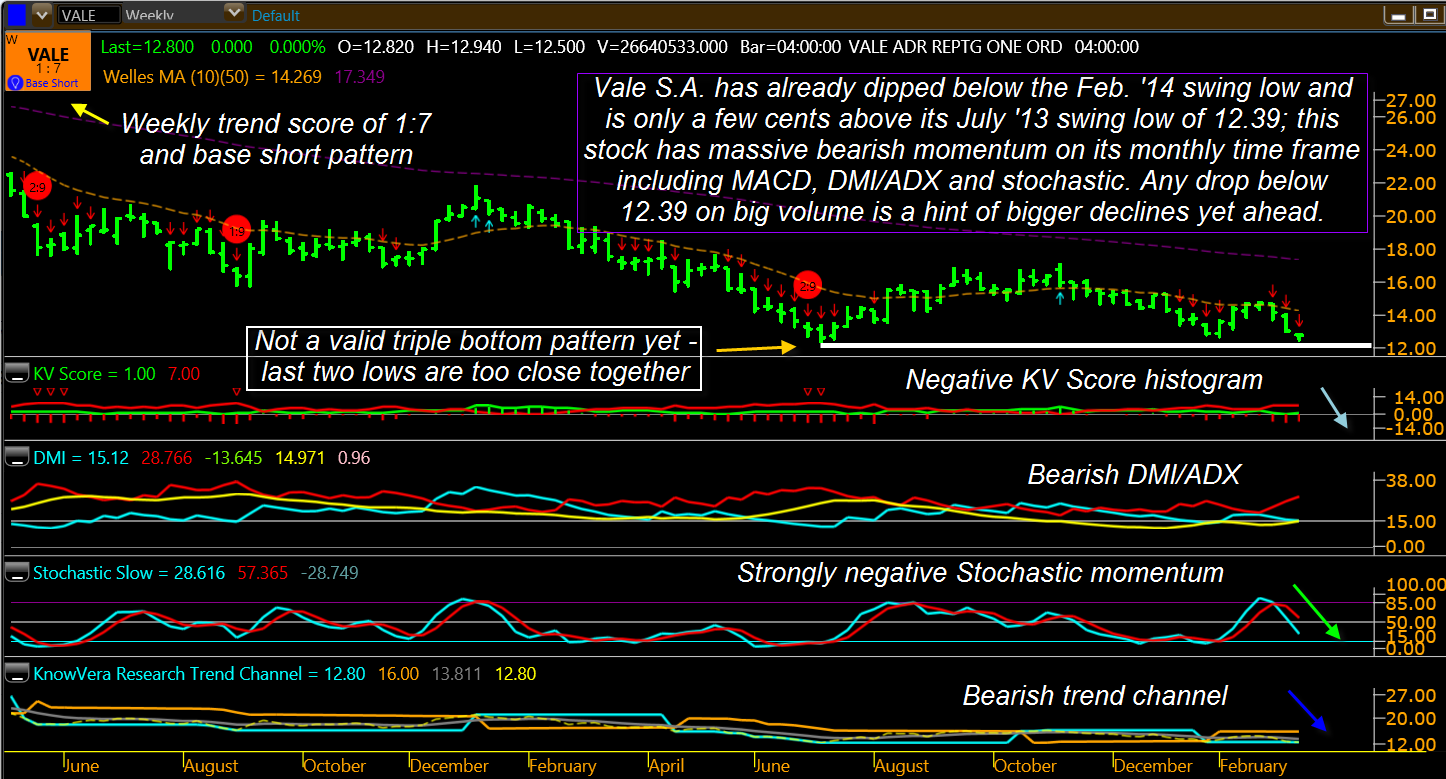
| Stocks with strongly negative or positive trends on their daily and weekly time frames are prime candidates for further visual evaluation, once identified with suitable market scanning software; right now some of the major mining stocks have been battered by the recent slide in copper prices and that makes the daily/weekly bearish trend scores for Vale S.A. (VALE) of special interest to traders and investors. Both time frames confirm a significant downtrend and when you also look at its monthly chart (not shown) you quickly realize that VALE's bear market still has a ways to go before it finally exhausts. Here is the weight of the evidence as of last week: 1. VALE's daily, weekly and monthly (D/W/M) charts all have bearish trend channels. 2. VALE's D/W/M charts also have bearish DMI (Directional Movement Index) indicators along with rising ADX (Average Directional index) values. 3. VALE's W/M charts feature strongly negative stochastic indicators; the one on the monthly chart looks like a "gift" for long-term trend followers who are currently short this large cap mining issue. 4. Although the pattern on VALE's weekly chart in Figure 1 might be mistakenly labelled by novice technicians as a triple bottom (3B), note that the second and third swing lows are much too close to each other for this to be a completed, valid 3B setup now. 5. Note how weak the bounce from the second bottom was; once it hit the 10-bar moving average it stalled and quickly retraced more than 100% of the entire bounce. This shows that the "dumb money" was doing the buying and that the smart money are the folks now intent on driving VALE's valuation well below the 12.39 swing low set back in the summer of 2013. Taken as a whole, the big picture here is simple to interpret: 1. Existing shorts in VALE are still in a good position here. 2. Any break below 12.39 on heavy volume and with similar weakness in other big multinational mining outfits like FCX and BHP should be the sign that VALE is going to get hammered yet again by the big money interests that control virtually all major stock markets, worldwide. |
|
| Figure 2. No bulls in sight here — not on VALE's weekly chart, anyway. The stock's monthly chart shows a bearish stochastic that still has a long, long way to go before it finally bottoms out. |
| Graphic provided by: KnowVera Research LLC. |
| |
| As you witness these key commodity-linked stocks get trashed, please keep in mind that global deflation has already begun to kick in, despite the attempts of the various central banks to print their way to prosperity, and that this latest plunge by copper is yet another sign that global growth is stagnant and already beginning to go negative. Expect not only stock prices — virtually all of them — to fall en masse, but also the value of real estate (a true "part deux-zy" correction this time), wages and just about every thing else bought/sold in the world that has a price tag. Start scanning now for companies with declining sales, negative earnings growth rates, high debt loads, and huge fixed overhead costs for wages, plant, and equipment. All are likely to see their stocks slaughtered again, just like we saw in 1973-1974, 2000-2002 and 2007-2009. Make some money shorting as you see low risk setups like this one in VALE and then make sure you have plenty of cash on hand to buy with both hands once the smoke clears and a new generational bull market begins sometime around early 2017 or 2018. The coming sell off in the next two to three years is likely going to be as severe and relentless as the last five years of the bull market were profitable and persistent. Learn now to spot the fundamentally weak stocks with bearish momentum on their D/W/M charts now so you can sell those that you still own before the bottom falls out and so you can begin to profit as the selling spree begins in 2014, accelerates in 2015 and goes into freefall during 2016. I have been analyzing charts since 1979 and can plainly state that I have never seen an epic bear market setup like this one in the US stock indexes — ever. Now, more than ever, it pays to trade and invest with extreme wisdom and discretion, getting ready to keep most of your trading capital in cash even as you learn to trade the short side with a small portion of your funds in high probability, low risk setups with massive multi-timeframe bearish momentum. See you again here soon. |
Freelance financial markets writer and online publisher of the Trendzetterz.com S&P 500 Weekly Forecast service.
| Title: | Market consultant and writer |
| Company: | Trendzetterz |
| Address: | 81 Hickory Hollow Drive |
| Crossville, TN 38555 | |
| Phone # for sales: | 904-303-4814 |
| Website: | trendzetterz.com |
| E-mail address: | support@trendzetterz.com |
Traders' Resource Links | |
| Trendzetterz has not added any product or service information to TRADERS' RESOURCE. | |
Click here for more information about our publications!
PRINT THIS ARTICLE

Request Information From Our Sponsors
- StockCharts.com, Inc.
- Candle Patterns
- Candlestick Charting Explained
- Intermarket Technical Analysis
- John Murphy on Chart Analysis
- John Murphy's Chart Pattern Recognition
- John Murphy's Market Message
- MurphyExplainsMarketAnalysis-Intermarket Analysis
- MurphyExplainsMarketAnalysis-Visual Analysis
- StockCharts.com
- Technical Analysis of the Financial Markets
- The Visual Investor
- VectorVest, Inc.
- Executive Premier Workshop
- One-Day Options Course
- OptionsPro
- Retirement Income Workshop
- Sure-Fire Trading Systems (VectorVest, Inc.)
- Trading as a Business Workshop
- VectorVest 7 EOD
- VectorVest 7 RealTime/IntraDay
- VectorVest AutoTester
- VectorVest Educational Services
- VectorVest OnLine
- VectorVest Options Analyzer
- VectorVest ProGraphics v6.0
- VectorVest ProTrader 7
- VectorVest RealTime Derby Tool
- VectorVest Simulator
- VectorVest Variator
- VectorVest Watchdog