HOT TOPICS LIST
- MACD
- Fibonacci
- RSI
- Gann
- ADXR
- Stochastics
- Volume
- Triangles
- Futures
- Cycles
- Volatility
- ZIGZAG
- MESA
- Retracement
- Aroon
INDICATORS LIST
LIST OF TOPICS
PRINT THIS ARTICLE
by Koos van der Merwe
Is Herbalife a Ponzi scheme that should be sold? Bill Ackman seems to think so. What do the charts say?
Position: Buy
Koos van der Merwe
Has been a technical analyst since 1969, and has worked as a futures and options trader with First Financial Futures in Johannesburg, South Africa.
PRINT THIS ARTICLE
SHORT SQUEEZE
A Forecast For Herbalife
03/14/14 10:42:57 AMby Koos van der Merwe
Is Herbalife a Ponzi scheme that should be sold? Bill Ackman seems to think so. What do the charts say?
Position: Buy
| Bill Ackman, American hedge fund manager, has said that he'll take the Herbalife fight "to the end of the earth." This announcement was made on March 11, 2014 as Ackman stepped up his battle with the company, laying out why he believes the company is breaking Chinese laws that govern how companies are allowed to pay employees. Ackman, as we all know, has shorted the stock. Is he creating all this noise to profit from his short? On March 12, 2014 the stock was halted on the New York Stock Exchange pending news. What do the charts say? Is Bill Ackman correct? |

|
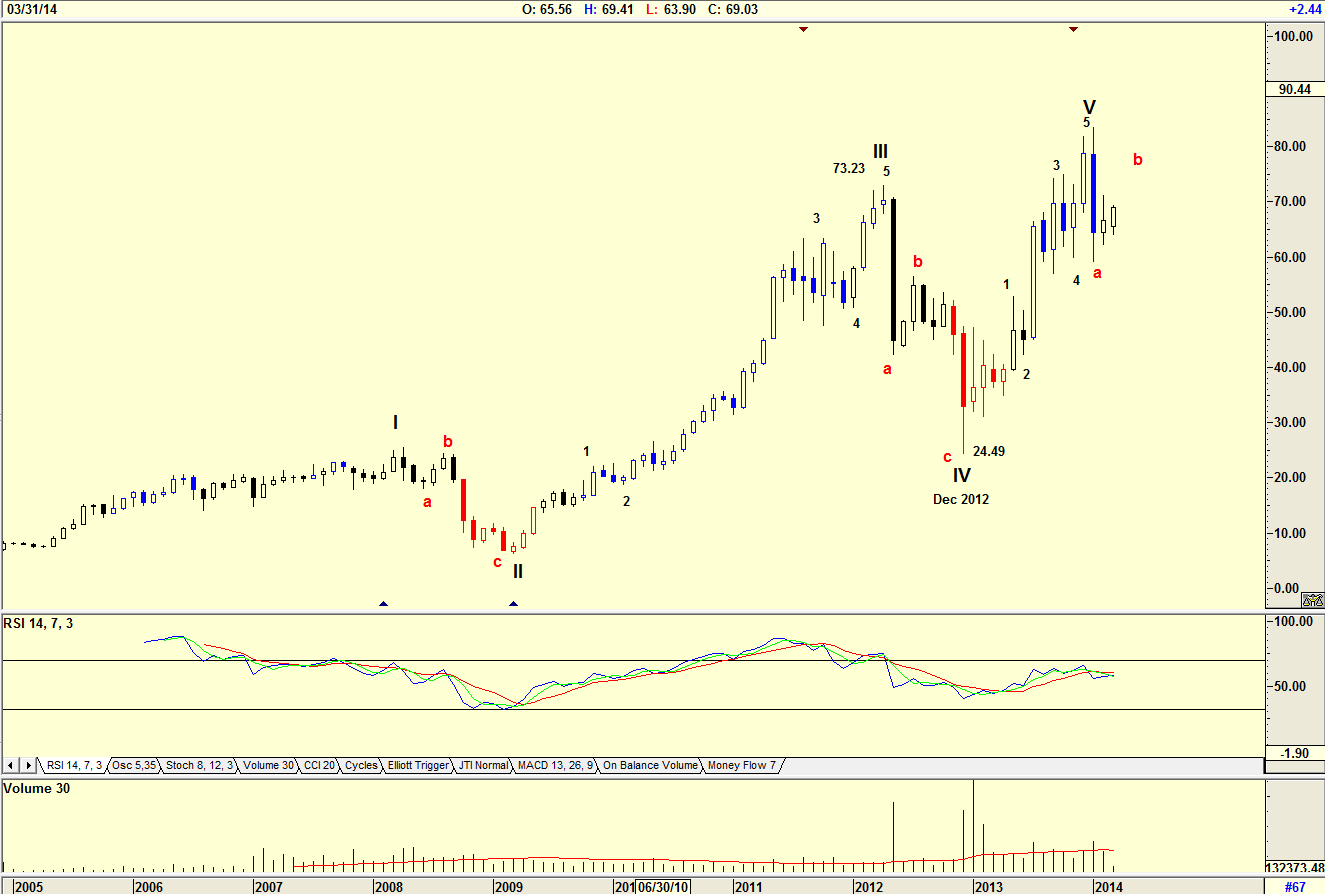
| Figure 1. Monthly chart with Elliott Wave count. |
| Graphic provided by: AdvancedGET. |
| |
| The chart in Figure 1 is a monthly chart with an Elliott Wave count that suggests a WAVE V has been completed and the share price could now be in an ABC correction which could take it as low as $24.49. The RSI shown is suggesting weakness as is the volume which shows strength as the share price fell, but weakness as the price rose. The share price should rise further in a wave b up move, but that could have already been completed. |

|
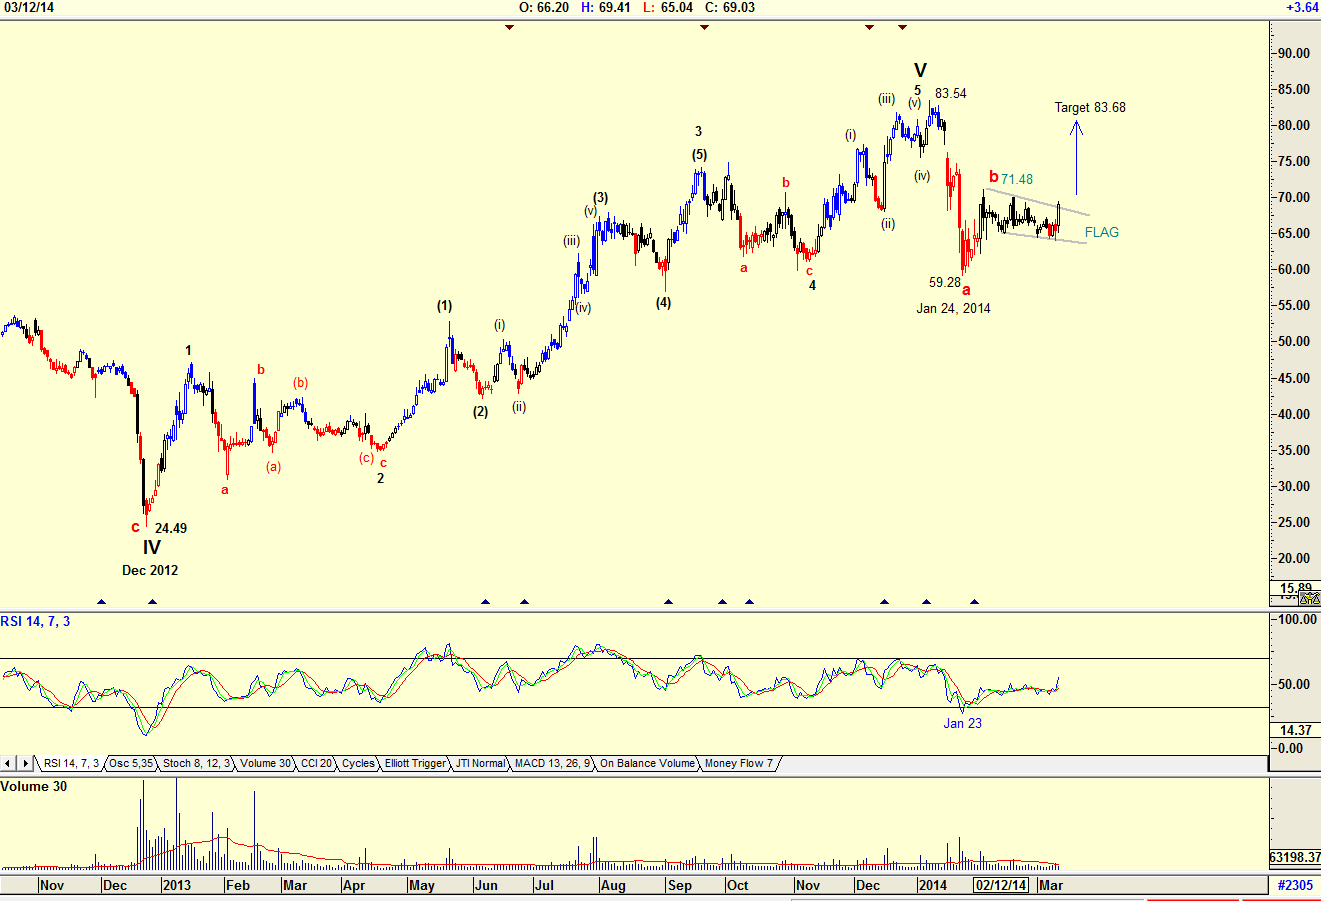
| Figure 2. Daily chart as of Match 11, 2014. |
| Graphic provided by: AdvancedGET. |
| |
| The chart in Figure 2 is a daily chart with an Elliott Wave count that is suggesting the price could be in a Wave b upward correction. The RSI indicator is bullish having given a buy on January 23, 2014. Do note the volume which showed weakness on the current rise in the share price. Also note the flag pattern which has formed, suggesting that the price could rise to $83.68 (71.48-59.28=12.20+71.48=83.68). Now what happened when the share started trading again? |

|
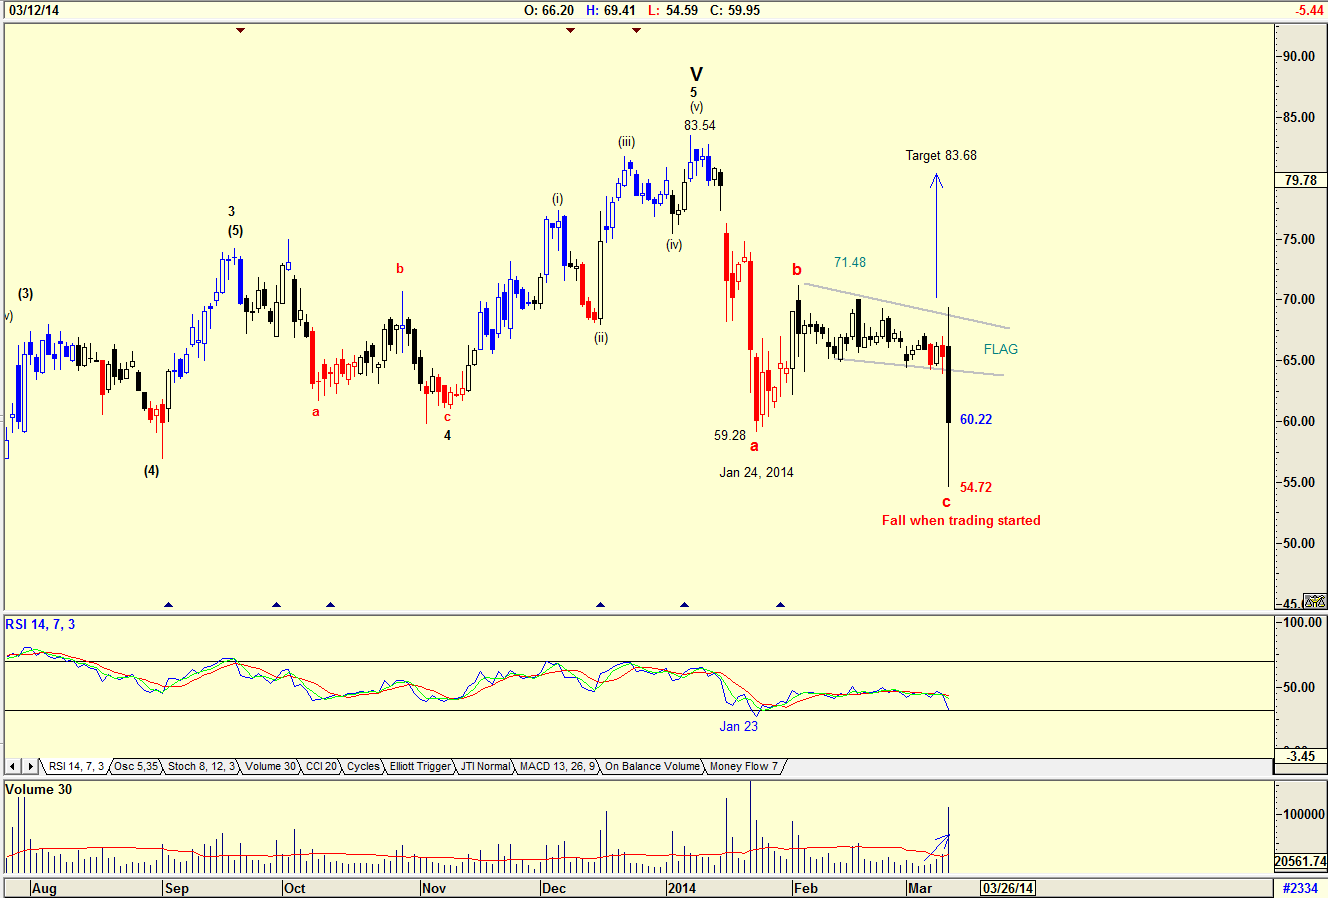
| Figure 3. Daily chart after share resumed trading on March 12. |
| Graphic provided by: AdvancedGET. |
| |
| The chart in Figure 3 is a chart showing what happened when the share started trading again after trading was halted on March 12, 2014. The price fell to $54.72 on high volume, but quickly rose to $60.22. The RSI indicator has dipped with the fall in the share price. Do note how volume started rising as the share price fell over the previous four days suggesting that weakness would occur. Also note that the share price fell below the low $59.28, the low of the January 24, 2014 wave a. This suggests that the wave C correction could be complete, and the share price should start rising in a WAVE I. Yes, I would be a buyer of HLF at present levels. Technical analysis has shown me that Mr. Ackman may have achieved the correction he was looking for to cover his short position, so with him possibly now out of the share, the price should start rising. |
Has been a technical analyst since 1969, and has worked as a futures and options trader with First Financial Futures in Johannesburg, South Africa.
| Address: | 3256 West 24th Ave |
| Vancouver, BC | |
| Phone # for sales: | 6042634214 |
| E-mail address: | petroosp@gmail.com |
Click here for more information about our publications!
Comments

Request Information From Our Sponsors
- StockCharts.com, Inc.
- Candle Patterns
- Candlestick Charting Explained
- Intermarket Technical Analysis
- John Murphy on Chart Analysis
- John Murphy's Chart Pattern Recognition
- John Murphy's Market Message
- MurphyExplainsMarketAnalysis-Intermarket Analysis
- MurphyExplainsMarketAnalysis-Visual Analysis
- StockCharts.com
- Technical Analysis of the Financial Markets
- The Visual Investor
- VectorVest, Inc.
- Executive Premier Workshop
- One-Day Options Course
- OptionsPro
- Retirement Income Workshop
- Sure-Fire Trading Systems (VectorVest, Inc.)
- Trading as a Business Workshop
- VectorVest 7 EOD
- VectorVest 7 RealTime/IntraDay
- VectorVest AutoTester
- VectorVest Educational Services
- VectorVest OnLine
- VectorVest Options Analyzer
- VectorVest ProGraphics v6.0
- VectorVest ProTrader 7
- VectorVest RealTime Derby Tool
- VectorVest Simulator
- VectorVest Variator
- VectorVest Watchdog
