

HOT TOPICS LIST
- MACD
- Fibonacci
- RSI
- Gann
- ADXR
- Stochastics
- Volume
- Triangles
- Futures
- Cycles
- Volatility
- ZIGZAG
- MESA
- Retracement
- Aroon
INDICATORS LIST
LIST OF TOPICS
PRINT THIS ARTICLE
by Donald W. Pendergast, Jr.
Shares of State Street Corporation are off to a rough start in 2014, but even larger declines may be just around the corner.
Position: N/A
Donald W. Pendergast, Jr.
Freelance financial markets writer and online publisher of the Trendzetterz.com S&P 500 Weekly Forecast service.
PRINT THIS ARTICLE
CONSOLID FORMATION
STT: Bearish Continuation Pattern Forming?
03/14/14 10:36:08 AMby Donald W. Pendergast, Jr.
Shares of State Street Corporation are off to a rough start in 2014, but even larger declines may be just around the corner.
Position: N/A
| Since peaking out at 76.24 on January 7, 2014, shares of State Street Corp. (STT) have declined by 12.3% and are now enmeshed in a fairly well defined consolidation range pattern — a pattern that when viewed against the backdrop of the stock's weekly chart may imply much more significant declines for this key financial sector stock as we approach the second quarter of 2014. Here's a closer look, using STT's daily and weekly trend scores (Figure 1) and its daily chart (Figure 2). |
|
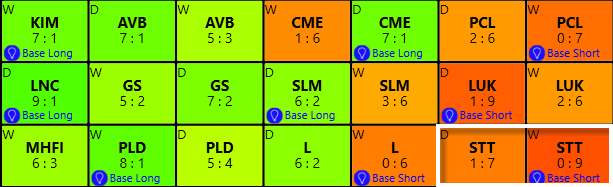
| Figure 1. State Street Corp. (STT) has the most bearish weekly trend score of all the financial sector issues tracked in the KVR software. |
| Graphic provided by: KnowVera Research LLC. |
| |
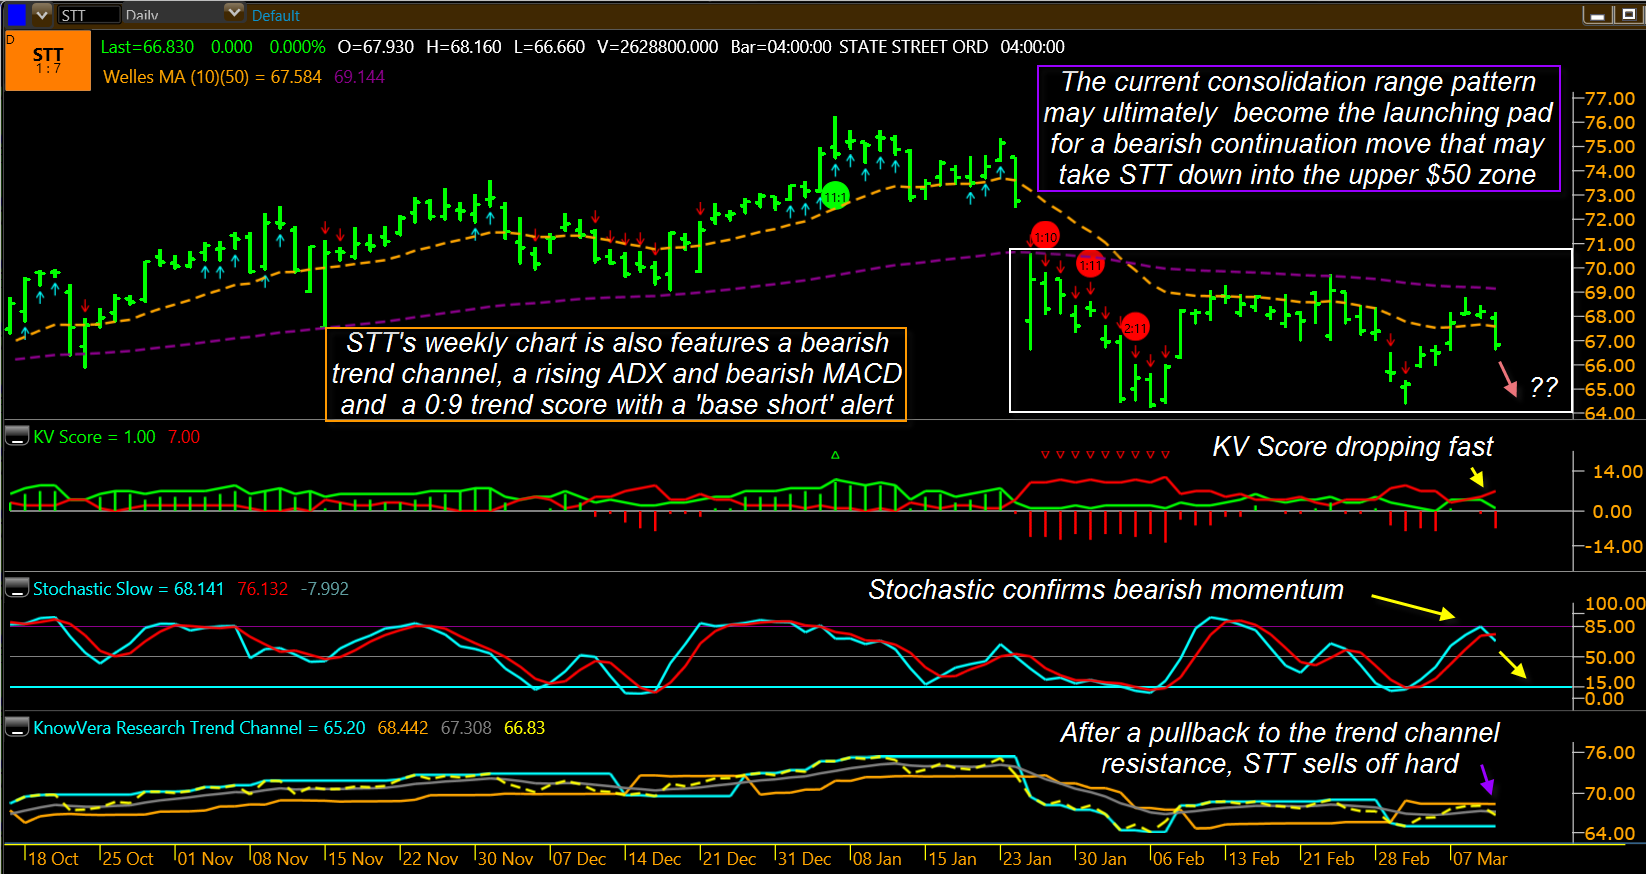
| Reviewing the daily/weekly trend scores of major financial sector stocks in the KVR (KnowVera Research) trend monitor reveals that STT is a stock of interest to those looking to add new short positions to their portfolios; note that this stock has the most bearish scores of all the financial sector (XLF) issues tracked by the KVR software and that its 0:9 trend score and 'base short' ranking suggest that this is an equity that may only be warming up before going into an even larger decline. And since the daily trend score for STT is also nice and bearish at 1:7 (note that the most bearish stocks have deep orange color and the most bullish a bright lime green hue), this is certainly a stock worth checking out on its actual price charts. Here are the key details on STT"s daily chart: 1. After putting in a double bottom pattern, the stock bounced up toward its 50-bar moving average (purple dashed line), lost momentum and has now rolled over sharply again. 2. The daily stochastic has also confirmed this bearish turn. 3. The KnowVera Research trend channel (bottom of chart) has managed to contain the entire pullback, confirming the strength of the prior down trend that started in late January 2014. 4. The weekly chart trend channel has been in bearish mode since February 1, 2014 and also features a bearish MACD and a bearish DMI/ADX combo. All told, there's not a bullish bone to be seen on STT's daily or weekly chart. What is clear is that negative momentum is building and that it's the "smart money" that appears to be doing the bulk of the selling. With a defined support level of 64.30 at the lower end of the consolidation range, the big question now is whether STT will experience a tradable bounce from that level or if it will simply start falling at such a rate of speed as to render that support area useless against such powerful bearish forces on the weekly time frame chart. |
|
| Figure 2. STT's current downswing appears to have an easy ride down toward the bottom of the range near 64.30. This consolidation pattern (white rectangle) may eventually prove to be the launch pad for a major bearish continuation move. |
| Graphic provided by: KnowVera Research LLC. |
| |
| Swing traders don't really need to worry about what happens once 64.30 is hit; they should simply consider going short at the next session's open and ride the drop to that level for all it's worth; using 66.66 as a hypothetical entry price (Tuesday's low) and 64.30 as a profit target and 68.16 as the initial stop loss, we find that this trade has a nominal risk-reward ratio of 1.57 to 1. Considering that STT may also break well below 64.30 if a bearish continuation move plays out, this trade may also be of interest to those looking to profit from a larger degree trend move. Trade risk should be kept at 2% or less and your swing trading portfolio should be well-diversified among stocks from several sectors and/or industry groups. Trade wisely until we meet here again. |
Freelance financial markets writer and online publisher of the Trendzetterz.com S&P 500 Weekly Forecast service.
| Title: | Market consultant and writer |
| Company: | Trendzetterz |
| Address: | 81 Hickory Hollow Drive |
| Crossville, TN 38555 | |
| Phone # for sales: | 904-303-4814 |
| Website: | trendzetterz.com |
| E-mail address: | support@trendzetterz.com |
Traders' Resource Links | |
| Trendzetterz has not added any product or service information to TRADERS' RESOURCE. | |
Click here for more information about our publications!
PRINT THIS ARTICLE

Request Information From Our Sponsors
- StockCharts.com, Inc.
- Candle Patterns
- Candlestick Charting Explained
- Intermarket Technical Analysis
- John Murphy on Chart Analysis
- John Murphy's Chart Pattern Recognition
- John Murphy's Market Message
- MurphyExplainsMarketAnalysis-Intermarket Analysis
- MurphyExplainsMarketAnalysis-Visual Analysis
- StockCharts.com
- Technical Analysis of the Financial Markets
- The Visual Investor
- VectorVest, Inc.
- Executive Premier Workshop
- One-Day Options Course
- OptionsPro
- Retirement Income Workshop
- Sure-Fire Trading Systems (VectorVest, Inc.)
- Trading as a Business Workshop
- VectorVest 7 EOD
- VectorVest 7 RealTime/IntraDay
- VectorVest AutoTester
- VectorVest Educational Services
- VectorVest OnLine
- VectorVest Options Analyzer
- VectorVest ProGraphics v6.0
- VectorVest ProTrader 7
- VectorVest RealTime Derby Tool
- VectorVest Simulator
- VectorVest Variator
- VectorVest Watchdog