

HOT TOPICS LIST
- MACD
- Fibonacci
- RSI
- Gann
- ADXR
- Stochastics
- Volume
- Triangles
- Futures
- Cycles
- Volatility
- ZIGZAG
- MESA
- Retracement
- Aroon
INDICATORS LIST
LIST OF TOPICS
PRINT THIS ARTICLE
by Matt Blackman
Copper, a powerful indicator of global manufacturing demand, has been falling and not by just a little. Why and what does it mean for markets?
Position: N/A
Matt Blackman
Matt Blackman is a full-time technical and financial writer and trader. He produces corporate and financial newsletters, and assists clients in getting published in the mainstream media. He is the host of TradeSystemGuru.com. Matt has earned the Chartered Market Technician (CMT) designation. Find out what stocks and futures Matt is watching on Twitter at www.twitter.com/RatioTrade
PRINT THIS ARTICLE
MARKET TIMING
The Copper Road To China And Impact On Markets
03/12/14 02:22:28 PMby Matt Blackman
Copper, a powerful indicator of global manufacturing demand, has been falling and not by just a little. Why and what does it mean for markets?
Position: N/A
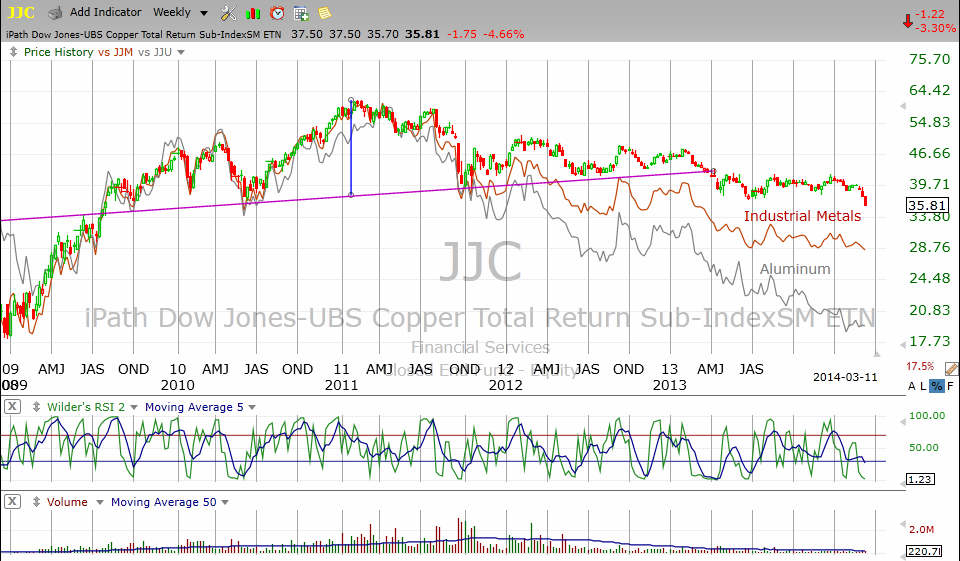
| Since the beginning of March, the iPath Dow Jones UBS Copper ETF (JJC) has fallen nearly 8% which is unusual for this time of the year. Normally this metal is in strong rally mode until July. Unfortunately, it is not alone. As we see in Figure 1, industrial metal and aluminum prices have also been falling — all three groups have been in strong downtrends since peaking in early 2011. So what's going on? |
|
| Figure 1 � Weekly chart comparing the performance of copper using the iPath Dow Jones-UBS Copper Total Return ETF (JJC) to industrial metals (iPath Dow Jones-UBS Industrial Metals Total Return ETF � JJM) and aluminum (the iPath Dow Jones-UBS Aluminum Total Return ETF � JJU). |
| Graphic provided by: TC2000.com. |
| |
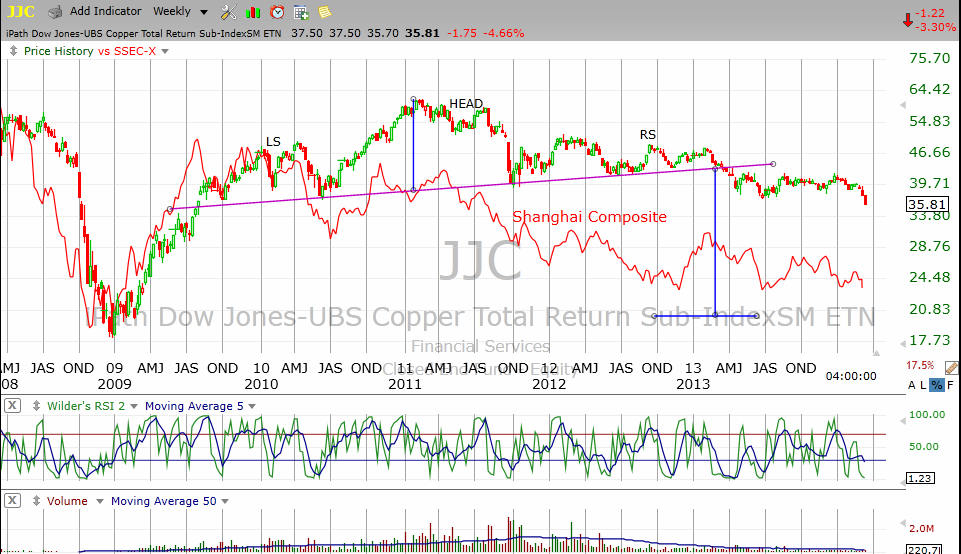
| Based on a bearish head & shoulders chart pattern on JJC (Figures 1 and 2), which was confirmed in 2013, it may still have a long way to drop. The minimum projected target for JJC would take it down to $20.17 taking it back to levels not seen since 2009. And as we see in Figure 2, the reason for weak copper markets could be summed up in one word — China. According to a March 10, 2014 Bloomberg report, China's CSI 300 plunged to its lowest level in five years on concern that the world's second largest economy is slowing. The drop has been led by companies such as Jianxi Copper Co. which slumped by more than the 5% daily limit. China "is the biggest consumer of commodities from copper to iron ore and rubber," according to the report. Further confounding experts is the fact that Chinese overseas shipments plunged 18.1% in February compared to analyst's mean estimates for a 7.5% increase. As we see in the Figure 2, the Chinese Shanghai Composite Index (red) peaked in late 2009 and has been falling ever since, pulling metals prices down with it. |
|
| Figure 2 � Weekly chart comparing the performance of copper to the Shanghai Composite (red) since the 2009 lows. |
| Graphic provided by: TC2000.com. |
| |
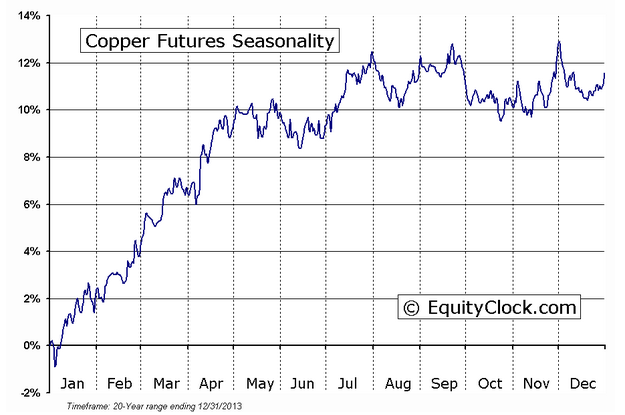
| Another concern is that in the last 20 years, the period from the second week in January through the end of July has historically accounted for a more than 12% gain each year so the recent trend in copper is strongly counter-seasonal (Figure 3). |
|
| Figure 3 � Composite chart of seasonal performance in copper for the 20-years ending December 31, 2012. |
| Graphic provided by: EquityClock.com. |
| |
| So as the world's second largest economy, what happens in China has significant global implications, something that commodity traders understand all too well. But the biggest question for traders and investors in North America and Europe is how long can stocks continue to fend off the impact of growing weakness in China? |
Matt Blackman is a full-time technical and financial writer and trader. He produces corporate and financial newsletters, and assists clients in getting published in the mainstream media. He is the host of TradeSystemGuru.com. Matt has earned the Chartered Market Technician (CMT) designation. Find out what stocks and futures Matt is watching on Twitter at www.twitter.com/RatioTrade
| Company: | TradeSystemGuru.com |
| Address: | Box 2589 |
| Garibaldi Highlands, BC Canada | |
| Phone # for sales: | 604-898-9069 |
| Fax: | 604-898-9069 |
| Website: | www.tradesystemguru.com |
| E-mail address: | indextradermb@gmail.com |
Traders' Resource Links | |
| TradeSystemGuru.com has not added any product or service information to TRADERS' RESOURCE. | |
Click here for more information about our publications!
Comments

Request Information From Our Sponsors
- StockCharts.com, Inc.
- Candle Patterns
- Candlestick Charting Explained
- Intermarket Technical Analysis
- John Murphy on Chart Analysis
- John Murphy's Chart Pattern Recognition
- John Murphy's Market Message
- MurphyExplainsMarketAnalysis-Intermarket Analysis
- MurphyExplainsMarketAnalysis-Visual Analysis
- StockCharts.com
- Technical Analysis of the Financial Markets
- The Visual Investor
- VectorVest, Inc.
- Executive Premier Workshop
- One-Day Options Course
- OptionsPro
- Retirement Income Workshop
- Sure-Fire Trading Systems (VectorVest, Inc.)
- Trading as a Business Workshop
- VectorVest 7 EOD
- VectorVest 7 RealTime/IntraDay
- VectorVest AutoTester
- VectorVest Educational Services
- VectorVest OnLine
- VectorVest Options Analyzer
- VectorVest ProGraphics v6.0
- VectorVest ProTrader 7
- VectorVest RealTime Derby Tool
- VectorVest Simulator
- VectorVest Variator
- VectorVest Watchdog