HOT TOPICS LIST
- MACD
- Fibonacci
- RSI
- Gann
- ADXR
- Stochastics
- Volume
- Triangles
- Futures
- Cycles
- Volatility
- ZIGZAG
- MESA
- Retracement
- Aroon
INDICATORS LIST
LIST OF TOPICS
PRINT THIS ARTICLE
by Donald W. Pendergast, Jr.
Growing ever more bearish on multiple time frames, shares of Freeport-McMoRan Copper and Gold look set for a trip back down into the mid-$20 range soon.
Position: N/A
Donald W. Pendergast, Jr.
Freelance financial markets writer and online publisher of the Trendzetterz.com S&P 500 Weekly Forecast service.
PRINT THIS ARTICLE
MOMENTUM
FCX: Hourly, Daily, And Weekly Bearish Momentum
03/12/14 02:19:05 PMby Donald W. Pendergast, Jr.
Growing ever more bearish on multiple time frames, shares of Freeport-McMoRan Copper and Gold look set for a trip back down into the mid-$20 range soon.
Position: N/A
| Shares of Freeport-McMoRan Copper and Gold (FCX) have taken a decidedly bearish turn after putting in a weekly double top pattern between November 2013 and January 2014; the stock is down nearly 18% since the start of 2014 and is now beginning to ramp down again, picking up bearish momentum day by day. Here's a closer look at what may be a high probability short sale in FCX over the next few weeks. |

|
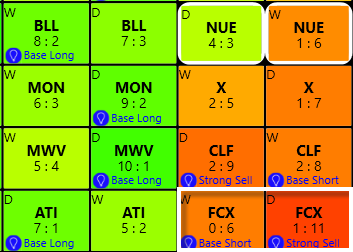
| Figure 1. Freeport-McMoRan Copper and Gold (FCX) has been identified by the KVR trend monitor as a strong sell on its daily time frame. |
| Graphic provided by: KnowVera Research LLC. |
| |
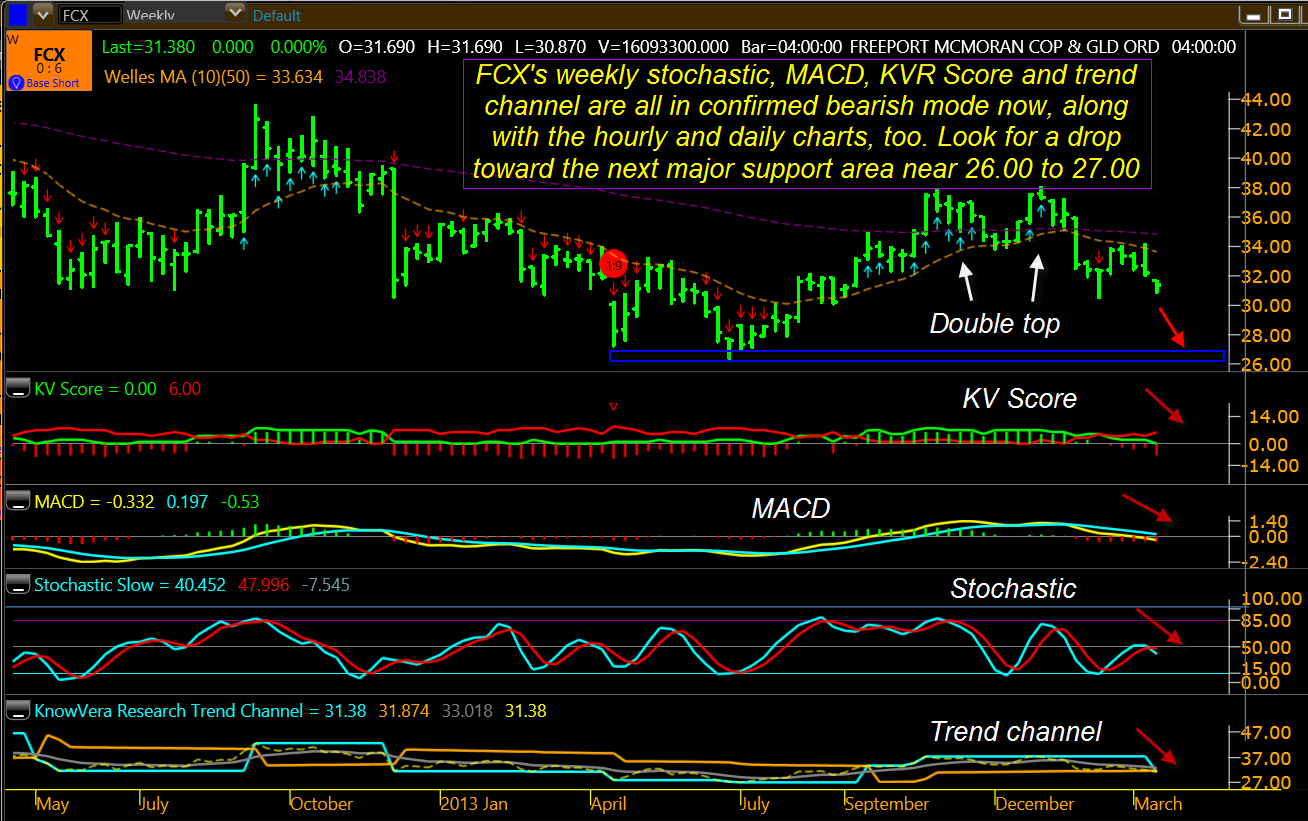
| Of all the component stocks in XLB (Select Sectors Materials ETF) none are more bearish now than FCX and CLF (Cleveland Cliffs); FCX has a truly horrific KVR (KnowVera Research) daily trend score of 1:11 (Figure 1), along with a 'strong sell' ranking to boot and also has a negative weekly trend score of 0:6 where it is ranked as a 'base short.' Perhaps the "smart money" knows a thing or two about FCX's future trend direction that we mere mortal traders and investors should be aware of in this high-profile US mining issue? Well, sure they do — they always do, simply because institutional/professional traders make 80% of all trades in the US equities markets, and as such, they have the massive buying power to ignite each new rally, terminate every downtrend, kill or accelerate each and every breakout/fakeout move — and a whole lot more. But since we usually don't know their exact game plan we need to look at the combined trends of various stocks to see which ones have the best chance of being pushed even higher or lower by the big money folks. Right now, the combined momentum for FCX on its hourly, daily and weekly time frames is 100% bearish, as follows: 1. The weekly stochastic has already made a major bearish turn. 2. The 30-, 60- and 120-minute charts along with the daily and weekly charts all have bearish trend channel configurations. That's five distinct time frames that confirm a major downtrend is already in force. 3. Minor pullbacks are under way on those intraday time frames, with the daily and weekly charts having just turned negative in the last couple of sessions. 4. The weekly MACD is in super bear mode now and that should limit the upside of the intraday chart pullbacks toward resistance. 5. The ultra-bearish 1:11 trend score of FCX's daily chart implies that there may be plenty more downside ahead once the current bounce in the stock exhausts. 6. The nominal risk/reward profile of a new short trade entry is better than 1.5 to 1, depending on the weekly chart stop loss/price target that is used. |

|
| Figure 2. FCX doesn't have anything remotely resembling a bullish reversal taking shape now; in fact, the stock has a very high probability of dipping down toward 26.00 to 27.00 as this latest downswing plays out. |
| Graphic provided by: KnowVera Research LLC. |
| |
| When trading the market it's always safest to trade in the direction of the primary trend, and in this case that trend is bearish for FCX; here are a couple of ways to do this: 1. Traders comfortable with buying a pullback toward resistance can use the 30- and 60-minute charts to help time an opportune short entry with half their position, adding another 1/4 position on a drop down past 30.87. If FCX then drops down past 30.51, consider adding the final quarter of your position. Use 32.50 as your initial stop and then let the hourly or 120-minute trend channel act as your trailing stop for the life of the trade, being sure to start taking profits as the 27.00 area is approached, which is the start of a major support zone for FCX. 2. Aggressive traders might want to simply go short on a drop beneath 30.87 but using the daily trend channel as the trailing stop instead of the tighter stop on the intraday time frames. Profits should also be taken (half if not all) near 27.00 on this trade, too. Either way you choose to go, keep your trade risks at 2% or less and keep close watch on this or any other short trade you make to avoid getting hammered by a short covering rally. Trade wisely until we meet here again. |
Freelance financial markets writer and online publisher of the Trendzetterz.com S&P 500 Weekly Forecast service.
| Title: | Market consultant and writer |
| Company: | Trendzetterz |
| Address: | 81 Hickory Hollow Drive |
| Crossville, TN 38555 | |
| Phone # for sales: | 904-303-4814 |
| Website: | trendzetterz.com |
| E-mail address: | support@trendzetterz.com |
Traders' Resource Links | |
| Trendzetterz has not added any product or service information to TRADERS' RESOURCE. | |
Click here for more information about our publications!
PRINT THIS ARTICLE

Request Information From Our Sponsors
- VectorVest, Inc.
- Executive Premier Workshop
- One-Day Options Course
- OptionsPro
- Retirement Income Workshop
- Sure-Fire Trading Systems (VectorVest, Inc.)
- Trading as a Business Workshop
- VectorVest 7 EOD
- VectorVest 7 RealTime/IntraDay
- VectorVest AutoTester
- VectorVest Educational Services
- VectorVest OnLine
- VectorVest Options Analyzer
- VectorVest ProGraphics v6.0
- VectorVest ProTrader 7
- VectorVest RealTime Derby Tool
- VectorVest Simulator
- VectorVest Variator
- VectorVest Watchdog
- StockCharts.com, Inc.
- Candle Patterns
- Candlestick Charting Explained
- Intermarket Technical Analysis
- John Murphy on Chart Analysis
- John Murphy's Chart Pattern Recognition
- John Murphy's Market Message
- MurphyExplainsMarketAnalysis-Intermarket Analysis
- MurphyExplainsMarketAnalysis-Visual Analysis
- StockCharts.com
- Technical Analysis of the Financial Markets
- The Visual Investor
