

HOT TOPICS LIST
- MACD
- Fibonacci
- RSI
- Gann
- ADXR
- Stochastics
- Volume
- Triangles
- Futures
- Cycles
- Volatility
- ZIGZAG
- MESA
- Retracement
- Aroon
INDICATORS LIST
LIST OF TOPICS
PRINT THIS ARTICLE
by Donald W. Pendergast, Jr.
Strongly negative daily and weekly momentum indicators suggest that Sirius XM Radio shares still have more downside ahead.
Position: N/A
Donald W. Pendergast, Jr.
Freelance financial markets writer and online publisher of the Trendzetterz.com S&P 500 Weekly Forecast service.
PRINT THIS ARTICLE
TREND-CHANNEL
SIRI: Serious Correction To Continue?
03/11/14 04:31:03 PMby Donald W. Pendergast, Jr.
Strongly negative daily and weekly momentum indicators suggest that Sirius XM Radio shares still have more downside ahead.
Position: N/A
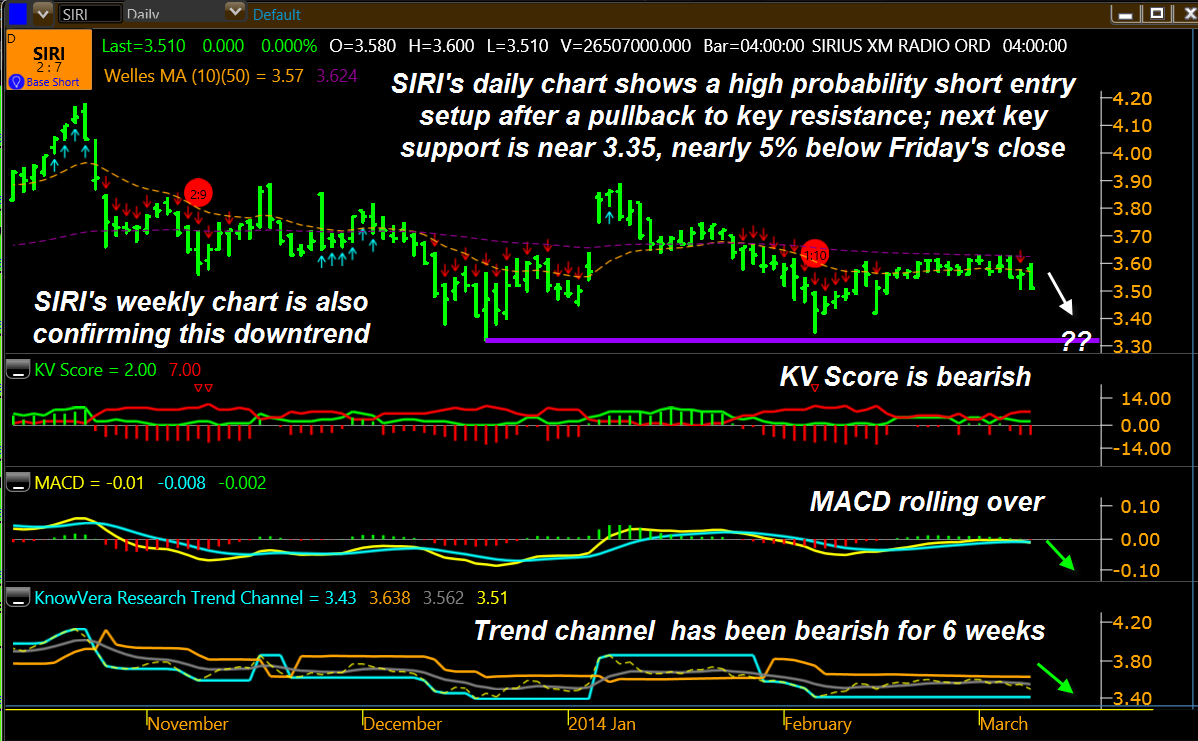
| After making a multiyear high at 4.18 in October 2013, shares of Sirius XM Radio (SIRI) have corrected by more than 16%; after a brief pullback to resistance on its daily chart, SIRI's momentum has once again taken on a bearish bias. Here's a closer look at this high probability, low risk short trade setup. |
|
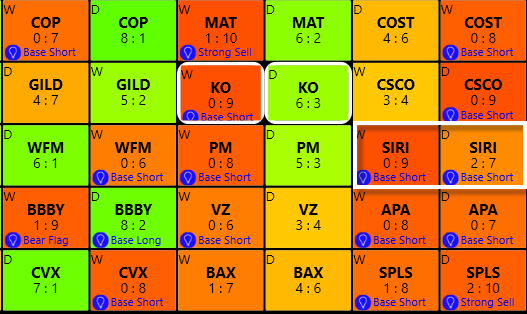
| Figure 1. Sirius XM Radio (SIRI) is flashing a 'base short' signal on both its daily and weekly time frames. |
| Graphic provided by: KnowVera Research LLC. |
| |
| One of the most reliable ways to determine whether to enter a swing trade (or even a long-term trend trade) is to check and see if a higher time frame than the one you intend to trade on is also in agreement to the anticipated direction of the trade. For example, if trading on a five-minute chart, use a 15- or 20-minute chart to confirm the major trend. If trading on a daily time frame, check the trend on the weekly chart, and so forth. Such trend agreement confirmations don't necessarily guarantee a major winning trade but the lack of such confirmation will surely keep you out of many marginal or even downright disastrous trades. Since the first job of a successful trader is to limit risk, knowing when to stay out of a non-confirmed trend trade situation is one of the easiest ways to preserve the value of your account equity. In the case of SIRI we have a substantial number of trend confirmations on its daily/weekly chart pair (weekly not shown), as follows: 1. Both charts have negative trend channels, confirming a bearish trend. 2. Moving average convergence-divergence (MACD) is bearish on both charts. 3. The KV Score (a summation indicator of all KVR indicators) shows a red histogram for both the daily and weekly charts, with the daily score being a '2:7 base short' and the weekly chart showing an even more bearish score of '0:9 base short.' 4. The ADX (average directional movement index) on the weekly chart is rising, confirming an acceleration in bearish momentum. 5. The 10-bar moving average on both charts is sloping downward, also confirming a bearish bias. So, we have clear evidence of substantial bearish momentum on SIRI's daily and weekly time frames, and to attempt to go long in the face of such trend power would appear to be foolish at the moment. Going short here, however, does look to be a high reward, low risk trading proposition, and here's a simple game plan on how this might be accomplished. |
|
| Figure 2. SIRI's key trend strength indicators are all summed up in its KV Score indicator; the daily chart score is 2:7 and the weekly chart shows an even more bearish score of 0:9. Both qualify as 'base short' trade setups according to the KnowVera Research trading system algorithms. |
| Graphic provided by: KnowVera Research LLC. |
| |
| Basically, we're looking at a nominal risk-reward ratio of approximately 1.6 to 1 for this short trade, assuming an entry price of 3.50, a stop loss of 3.60 and an initial profit target of 3.32 (the previous swing low); there is also a deeper swing support level at 3.04 which may eventually be hit too, but no one could possibly know when/if this is the short trade setup that will be the one to do this. If going short at 3.50 (one tick below the March 7, 2014 low) simply set your initial stop/targets as suggested above and then begin to trail with a two or three-bar trailing stop of the daily highs until 3.35 is reached; at that point take at least half of your open profits and consider letting the other half of the trade run if the bearish momentum appears to be gaining strength (with the major stock indexes also dropping hard in sympathy if possible). Tighten the trailing stop somewhat if SIRI drops below 3.30 and see how far down toward 3.04 it might be able to go, being ready to cover the trade at a moment's notice, should a short covering rally ensue. Keep your account trade risk low (about 1% max) on this trade and be sure to take profits if you get an unexpected "windfall" plunge in the stock (like 10 or 20% in one day or something like that). Trade wisely until we meet here again. |
Freelance financial markets writer and online publisher of the Trendzetterz.com S&P 500 Weekly Forecast service.
| Title: | Market consultant and writer |
| Company: | Trendzetterz |
| Address: | 81 Hickory Hollow Drive |
| Crossville, TN 38555 | |
| Phone # for sales: | 904-303-4814 |
| Website: | trendzetterz.com |
| E-mail address: | support@trendzetterz.com |
Traders' Resource Links | |
| Trendzetterz has not added any product or service information to TRADERS' RESOURCE. | |
Click here for more information about our publications!
PRINT THIS ARTICLE

Request Information From Our Sponsors
- StockCharts.com, Inc.
- Candle Patterns
- Candlestick Charting Explained
- Intermarket Technical Analysis
- John Murphy on Chart Analysis
- John Murphy's Chart Pattern Recognition
- John Murphy's Market Message
- MurphyExplainsMarketAnalysis-Intermarket Analysis
- MurphyExplainsMarketAnalysis-Visual Analysis
- StockCharts.com
- Technical Analysis of the Financial Markets
- The Visual Investor
- VectorVest, Inc.
- Executive Premier Workshop
- One-Day Options Course
- OptionsPro
- Retirement Income Workshop
- Sure-Fire Trading Systems (VectorVest, Inc.)
- Trading as a Business Workshop
- VectorVest 7 EOD
- VectorVest 7 RealTime/IntraDay
- VectorVest AutoTester
- VectorVest Educational Services
- VectorVest OnLine
- VectorVest Options Analyzer
- VectorVest ProGraphics v6.0
- VectorVest ProTrader 7
- VectorVest RealTime Derby Tool
- VectorVest Simulator
- VectorVest Variator
- VectorVest Watchdog