HOT TOPICS LIST
- MACD
- Fibonacci
- RSI
- Gann
- ADXR
- Stochastics
- Volume
- Triangles
- Futures
- Cycles
- Volatility
- ZIGZAG
- MESA
- Retracement
- Aroon
INDICATORS LIST
LIST OF TOPICS
PRINT THIS ARTICLE
by Koos van der Merwe
Does a possible reverse head & shoulder pattern tell us what to expect?
Position: Hold
Koos van der Merwe
Has been a technical analyst since 1969, and has worked as a futures and options trader with First Financial Futures in Johannesburg, South Africa.
PRINT THIS ARTICLE
HEAD & SHOULDERS
Following A Reverse Head & Shoulders Pattern
03/10/14 04:14:10 PMby Koos van der Merwe
Does a possible reverse head & shoulder pattern tell us what to expect?
Position: Hold
| Technical analysis patterns can tell you what to expect for the future, simply because they are and have been consistent in their prediction. One of the most reliable patterns is a head & shoulders pattern or a reverse head & shoulders pattern. When you look at charts of various gold indexes, and it looks as if a reverse head & shoulders pattern could be triggered, then you place it on your watch list, and wait for a trigger when the price breaks above the neckline. |

|
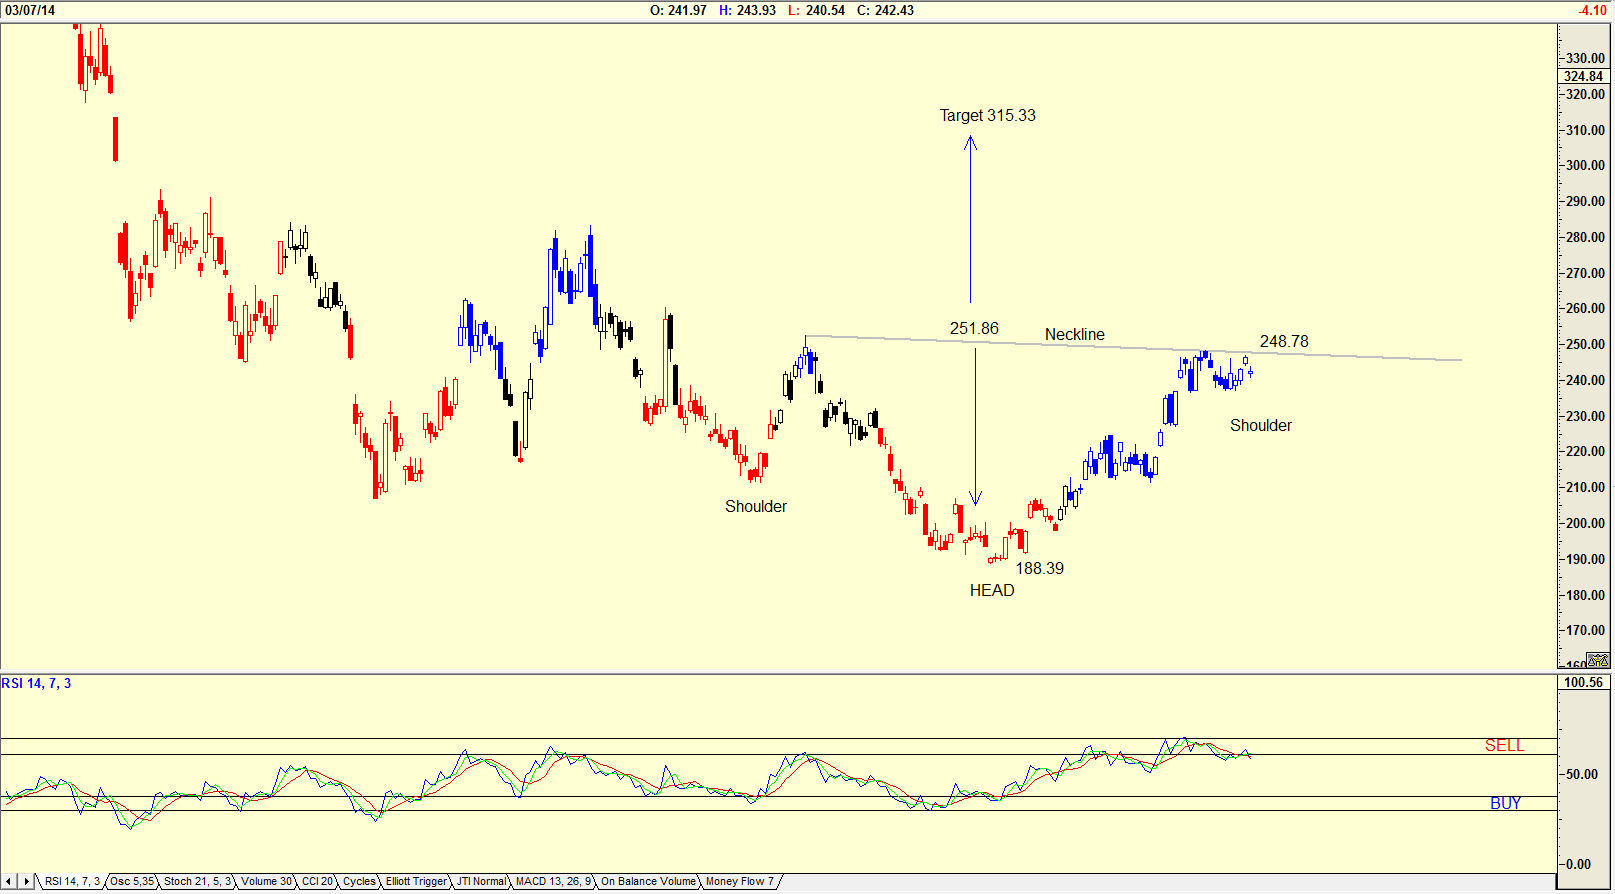
| Figure 1. Daily chart of the Amex Gold Bugs Index. |
| Graphic provided by: AdvancedGET. |
| |
| The chart in Figure 1 is of the Amex Gold Bugs Index (HUI). The index is suggesting that if it breaks above the neckline at 248.78, then it could rise to a high of 315.33. (251.86-188.39=63.47+251.86+315.33). Note the RSI indicator which is suggesting weakness. |

|
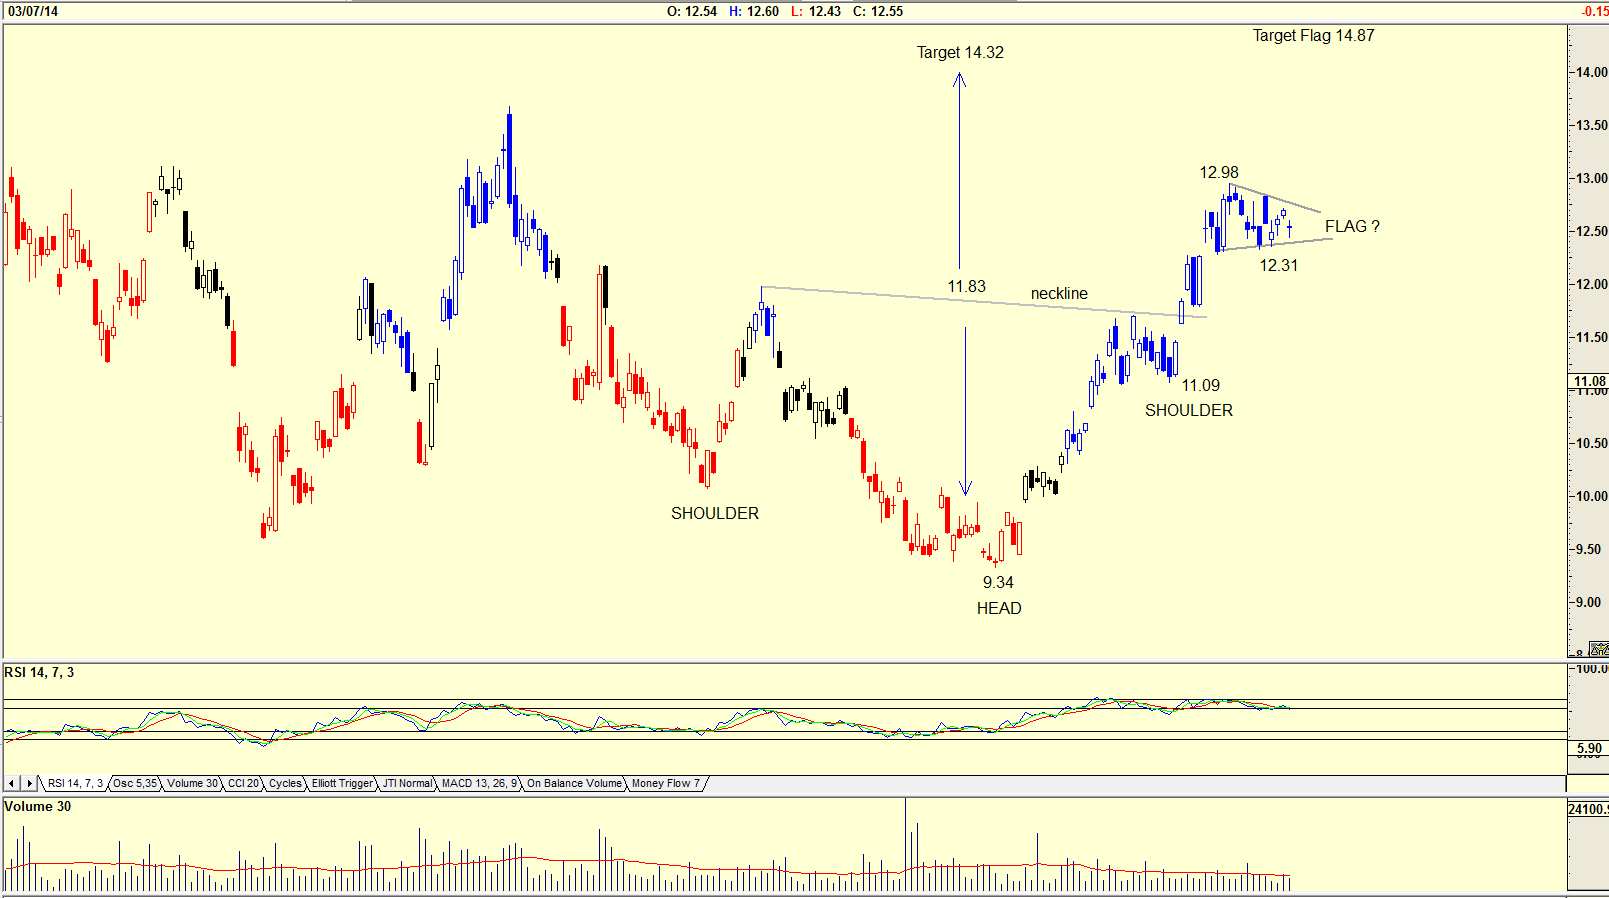
| Figure 2. i-Units Gold Index daily chart. |
| Graphic provided by: AdvancedGET. |
| |
| The chart in Figure 2 is the i-Units gold index quoted on the Canadian market. The reverse head & shoulders pattern is suggesting a target of $14.32. (11.83 - 9.34 = 2.49 + 11.83 = 14.32). The chart is showing that the neckline has been broken which means that the target of 14.32 could be reached. The price i-Unit gold index looks like it has formed a flag pattern suggesting a target of 14.87 (12.98 - 11.09 = 1.89 + 12.98 = 14.87). |

|
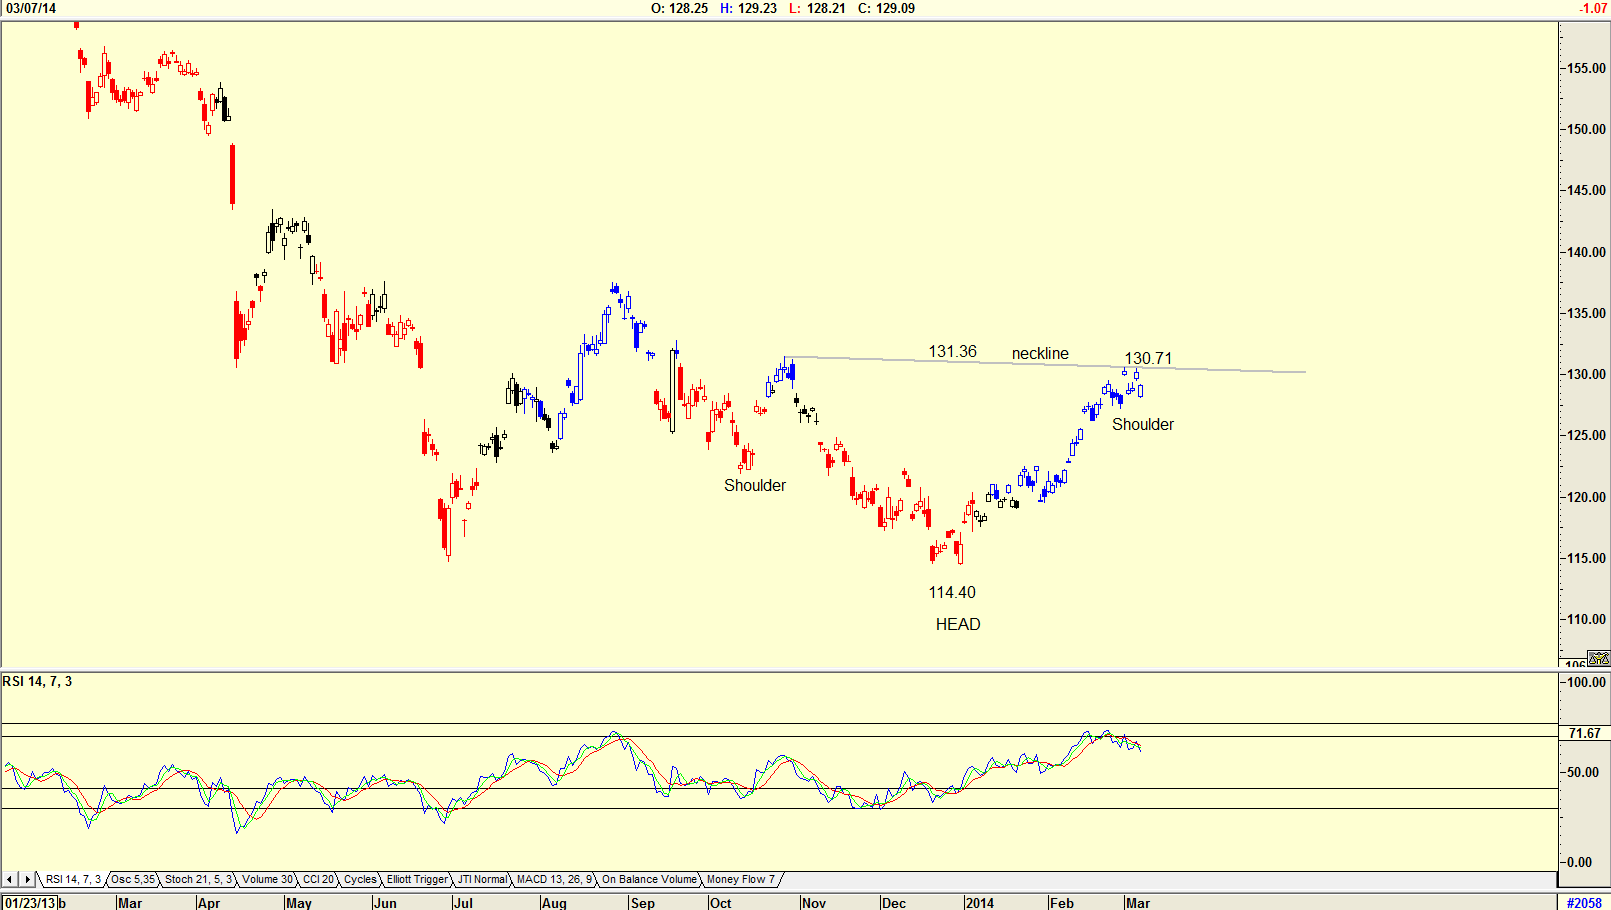
| Figure 3. Daily chart of streetTRACKS Gold. |
| Graphic provided by: AdvancedGET. |
| |
| The chart in Figure 3 is the streetTRACKS gold showing a reverse head & shoulders pattern with a target of 148.32 (131.36 - 114.40 = 16.96 + 131.36 = 148.32) should the neckline be broken. Once again the RSI indicator is looking negative suggesting that price should fall. All three charts that follow the Gold price are showing that a reverse head & shoulders pattern could be forming. However, until the neckline is broken as the price moves above it, the element of doubt exists. With the RSI index in all three charts looking negative, the right shoulder may take some time to develop. I would not be a buyer of any index that measures the movement of gold price. I would wait until the neckline of the reverse head & shoulders pattern is broken. |
Has been a technical analyst since 1969, and has worked as a futures and options trader with First Financial Futures in Johannesburg, South Africa.
| Address: | 3256 West 24th Ave |
| Vancouver, BC | |
| Phone # for sales: | 6042634214 |
| E-mail address: | petroosp@gmail.com |
Click here for more information about our publications!
Comments

Request Information From Our Sponsors
- StockCharts.com, Inc.
- Candle Patterns
- Candlestick Charting Explained
- Intermarket Technical Analysis
- John Murphy on Chart Analysis
- John Murphy's Chart Pattern Recognition
- John Murphy's Market Message
- MurphyExplainsMarketAnalysis-Intermarket Analysis
- MurphyExplainsMarketAnalysis-Visual Analysis
- StockCharts.com
- Technical Analysis of the Financial Markets
- The Visual Investor
- VectorVest, Inc.
- Executive Premier Workshop
- One-Day Options Course
- OptionsPro
- Retirement Income Workshop
- Sure-Fire Trading Systems (VectorVest, Inc.)
- Trading as a Business Workshop
- VectorVest 7 EOD
- VectorVest 7 RealTime/IntraDay
- VectorVest AutoTester
- VectorVest Educational Services
- VectorVest OnLine
- VectorVest Options Analyzer
- VectorVest ProGraphics v6.0
- VectorVest ProTrader 7
- VectorVest RealTime Derby Tool
- VectorVest Simulator
- VectorVest Variator
- VectorVest Watchdog
