HOT TOPICS LIST
- MACD
- Fibonacci
- RSI
- Gann
- ADXR
- Stochastics
- Volume
- Triangles
- Futures
- Cycles
- Volatility
- ZIGZAG
- MESA
- Retracement
- Aroon
INDICATORS LIST
LIST OF TOPICS
PRINT THIS ARTICLE
by Matt Blackman
The CBOE Market Volatility Index or VIX is popular with traders as a measure of fear in the market. But given just how volatile it is, how can it be used as a stock market indicator?
Position: N/A
Matt Blackman
Matt Blackman is a full-time technical and financial writer and trader. He produces corporate and financial newsletters, and assists clients in getting published in the mainstream media. He is the host of TradeSystemGuru.com. Matt has earned the Chartered Market Technician (CMT) designation. Find out what stocks and futures Matt is watching on Twitter at www.twitter.com/RatioTrade
PRINT THIS ARTICLE
VOLATILITY
Can The VIX Be Used To Help Identify Pending Stock Reversals?
03/07/14 03:22:54 PMby Matt Blackman
The CBOE Market Volatility Index or VIX is popular with traders as a measure of fear in the market. But given just how volatile it is, how can it be used as a stock market indicator?
Position: N/A
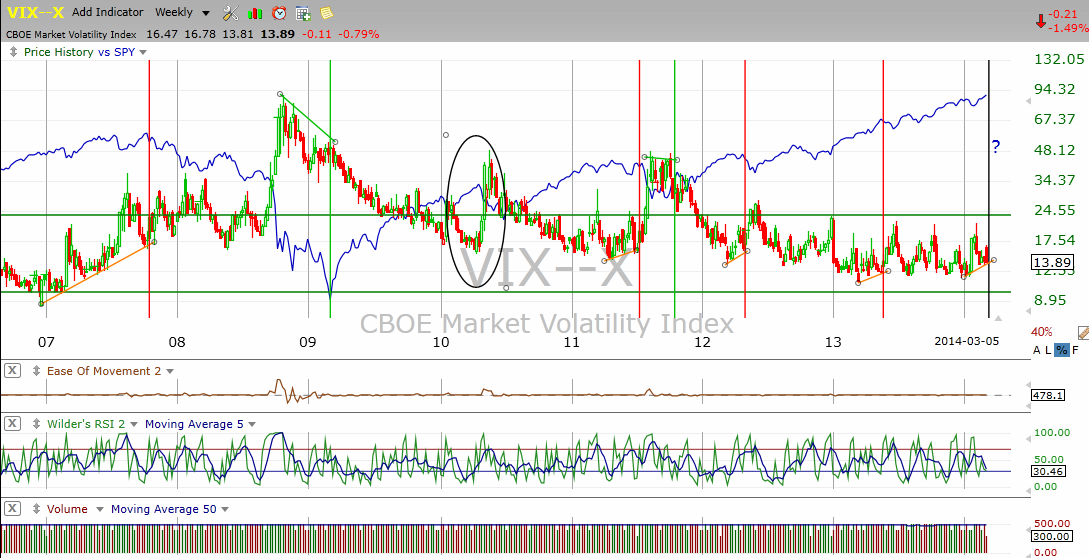
| There have been many articles written about the CBOE Market Volatility Index (VIX), which has also been called a fear index. Given just how volatile it can be and the different values at which tops and bottoms have occurred, many pundits have written it off as a reliable trading tool. But that may be because they are looking at it from the wrong perspective. Introduced in 1993 by the Chicago Board Options Exchange, the Volatility Index (VIX) was originally designed to measure the market's expectation of 30-day volatility implied by at-the-money S&P 100 index option prices. When stocks turn bearish, the VIX jumps, indicating that traders are reducing positions and buying puts so that it is negatively correlated with stock prices. The VIX can't be traded directly but it is traded as futures and exchange traded funds (ETFs). But as the weekly chart in Figure 1 shows, at nearly every major inflection point in the last six years the VIX provided warning in the way of divergence with the S&P 500 index with just one exception. |

|
| Figure 1 – Weekly chart of the VIX compared to the S&P500 (blue) showing bearish (red) and bullish (green) VIX divergences. In only one major reversal has the VIX not provided some warning (black oval). |
| Graphic provided by: TC2000.com. |
| |
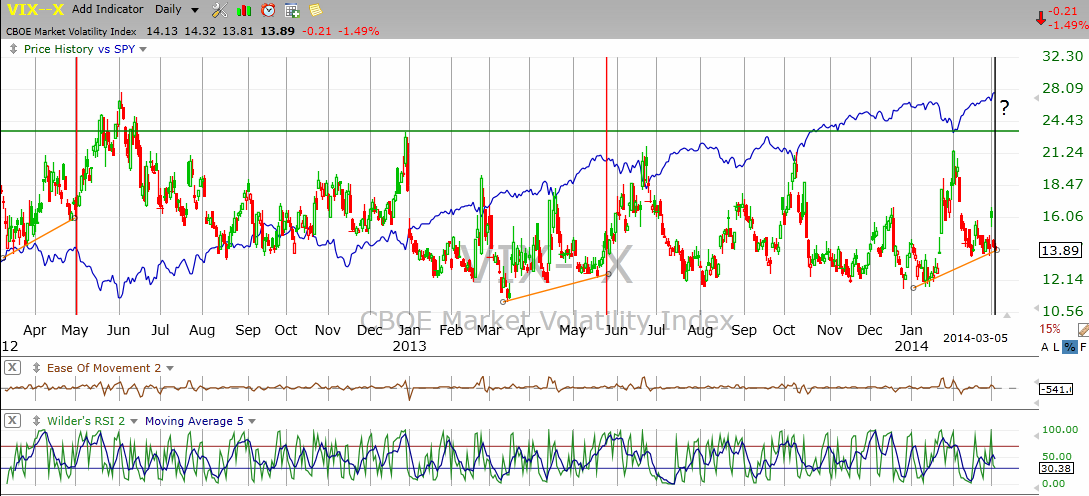
| In the chart in Figure 2 we take a closer look at the more recent bearish divergences and see that in almost every case, the VIX diverged in advance of the correction. Fear increased in advance of most tops and in fewer cases, receded ahead of bottoms. In more instances, fear peaked right around bottoms so it proved less valuable as a buy meter. |

|
| Figure 2 – Daily chart of the VIX and the SPX showing bearish reversals since March 2012 with the most recent bearish divergence from January into March. |
| Graphic provided by: TC2000.com. |
| |
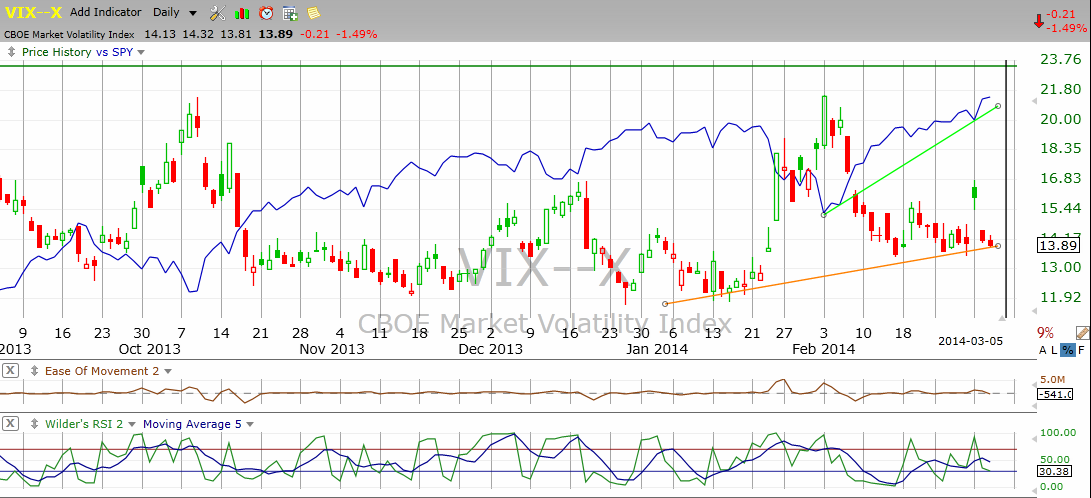
| In the chart in Figure 3, we zoom in closer to show the latest divergence to show how a trendline can be used to help time trades. We won't know exactly when the next top has occurred until the SPX trendline (green) has been broken. However, bearish divergence in the VIX shows that fear has been slowly but surely building in the market and with it the premium for buying correction protection. |

|
| Figure 3 – Chart focusing on the latest VIX divergence showing the latest uptrend line on the SPX (green). |
| Graphic provided by: TC2000.com. |
| |
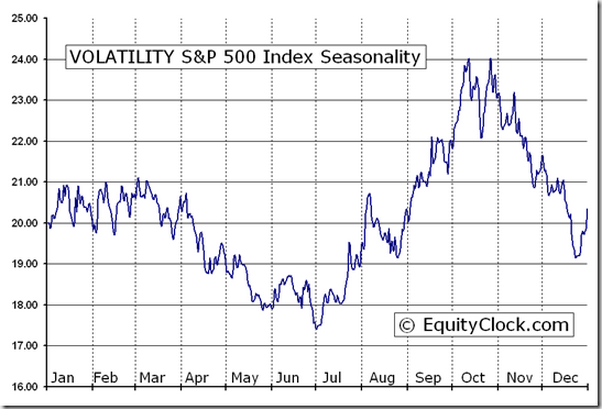
| There's one more factor to consider and that is seasonal performance. Over the last 20 years, the VIX has been flat for the first three months of the year then down until July which means the recent uptrend commencing in early January is counter-seasonal (Figure 4). If the VIX continues to rise, it will further indicate that the index is behaving unusually, providing corroborating evidence of a potential trend change. |

|
| Figure 4 – Composite seasonal chart of the VIX over the last 20 years showing seasons when it has been strong (July through October), weak (November through December) and flat (January to April). |
| Graphic provided by: www.EquityClock.com. |
| |
Matt Blackman is a full-time technical and financial writer and trader. He produces corporate and financial newsletters, and assists clients in getting published in the mainstream media. He is the host of TradeSystemGuru.com. Matt has earned the Chartered Market Technician (CMT) designation. Find out what stocks and futures Matt is watching on Twitter at www.twitter.com/RatioTrade
| Company: | TradeSystemGuru.com |
| Address: | Box 2589 |
| Garibaldi Highlands, BC Canada | |
| Phone # for sales: | 604-898-9069 |
| Fax: | 604-898-9069 |
| Website: | www.tradesystemguru.com |
| E-mail address: | indextradermb@gmail.com |
Traders' Resource Links | |
| TradeSystemGuru.com has not added any product or service information to TRADERS' RESOURCE. | |
Click here for more information about our publications!
Comments

|

Request Information From Our Sponsors
- StockCharts.com, Inc.
- Candle Patterns
- Candlestick Charting Explained
- Intermarket Technical Analysis
- John Murphy on Chart Analysis
- John Murphy's Chart Pattern Recognition
- John Murphy's Market Message
- MurphyExplainsMarketAnalysis-Intermarket Analysis
- MurphyExplainsMarketAnalysis-Visual Analysis
- StockCharts.com
- Technical Analysis of the Financial Markets
- The Visual Investor
- VectorVest, Inc.
- Executive Premier Workshop
- One-Day Options Course
- OptionsPro
- Retirement Income Workshop
- Sure-Fire Trading Systems (VectorVest, Inc.)
- Trading as a Business Workshop
- VectorVest 7 EOD
- VectorVest 7 RealTime/IntraDay
- VectorVest AutoTester
- VectorVest Educational Services
- VectorVest OnLine
- VectorVest Options Analyzer
- VectorVest ProGraphics v6.0
- VectorVest ProTrader 7
- VectorVest RealTime Derby Tool
- VectorVest Simulator
- VectorVest Variator
- VectorVest Watchdog
