HOT TOPICS LIST
- MACD
- Fibonacci
- RSI
- Gann
- ADXR
- Stochastics
- Volume
- Triangles
- Futures
- Cycles
- Volatility
- ZIGZAG
- MESA
- Retracement
- Aroon
INDICATORS LIST
LIST OF TOPICS
PRINT THIS ARTICLE
by Koos van der Merwe
Here's another health stock to look at.
Position: Sell
Koos van der Merwe
Has been a technical analyst since 1969, and has worked as a futures and options trader with First Financial Futures in Johannesburg, South Africa.
PRINT THIS ARTICLE
GAPS
Arrowhead Research Corp.
03/06/14 04:12:41 PMby Koos van der Merwe
Here's another health stock to look at.
Position: Sell
| On March 3, 2014, Arrowhead Research Corp. (ARWR) received regulatory approval to begin Phase 2a trial of chronic Hepatitis B Candidate ARC-520. ARWR is a biopharmaceutical company that is leveraging its proprietary drug delivery technologies to develop targeted drugs based on the RNA interference mechanism that efficiently silences disease-causing genes. This is risky because the company may spend billions of dollars on research and development and its final product may be rejected by the U.S. Food and Drug Administration (FDA) as non-effective. That is the risk that any company that develops new drugs takes. Their second risk is that once their patents expire, generic drugs step in. So, should you invest in pharmaceutical research companies? |

|
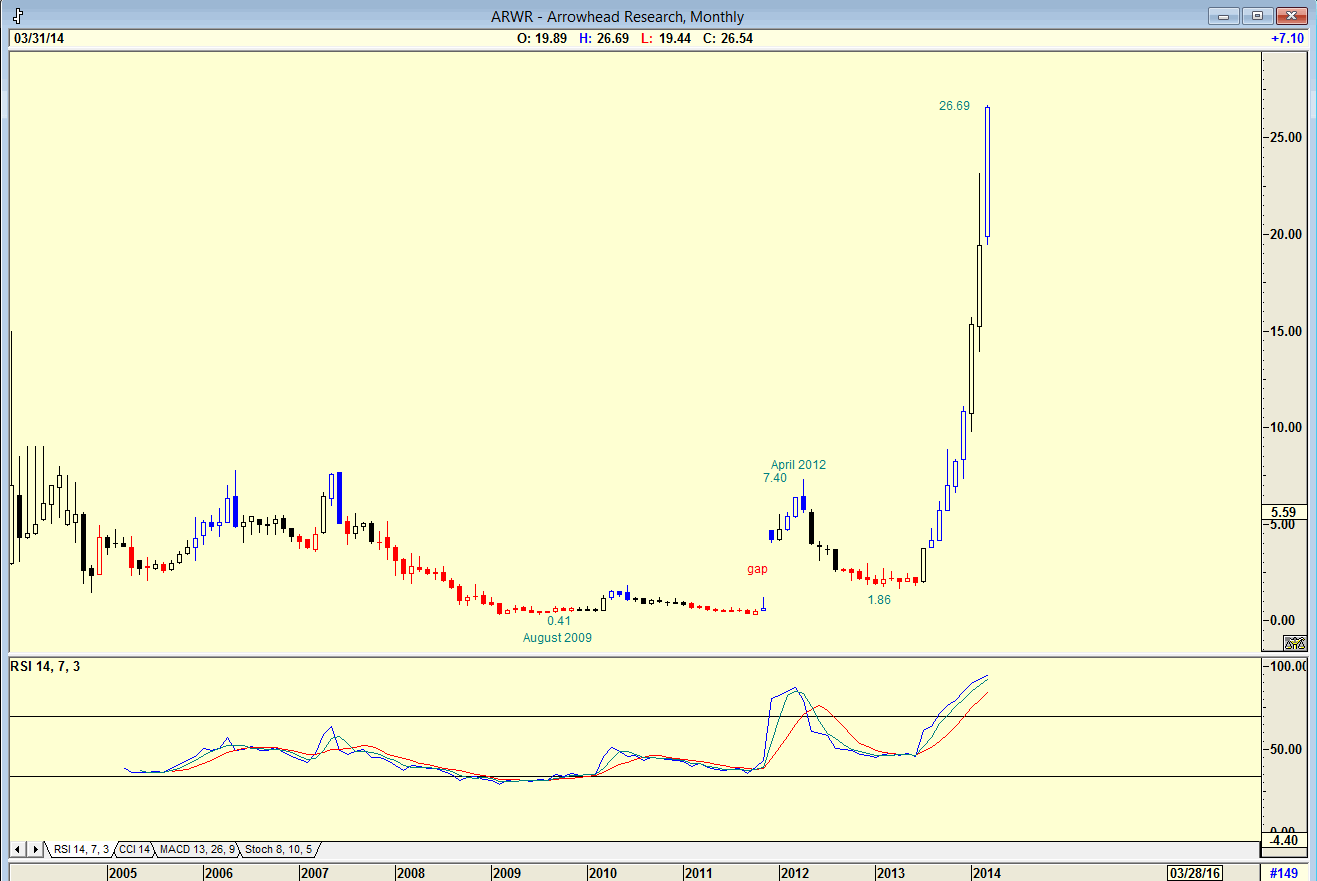
| Figure 1. Monthly chart suggesting a correction. |
| Graphic provided by: AdvancedGET. |
| |
| On the monthly chart of ARWR in Figure 1 you see how the price rose from a low of 41 cents in August 2009 to its present price of $26.69. Note how in April 2012 the price fell from $7.40 to $1.86 to fill the gap. Also note the RSI which is at extreme overbought levels suggesting that a sell signal could be in the cards. |

|
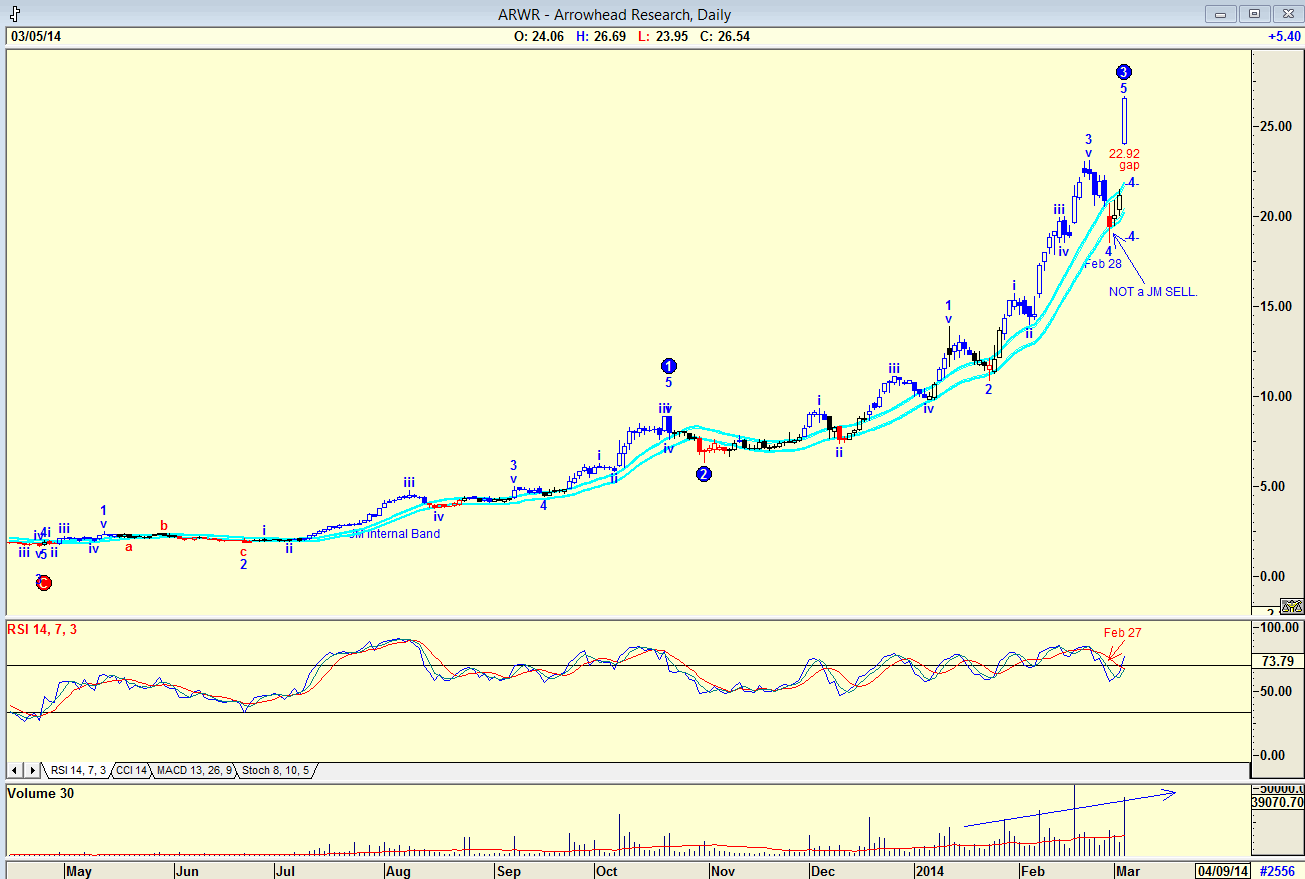
| Figure 2. Daily chart showing the rise on a gap. |
| Graphic provided by: AdvancedGET. |
| |
| The chart in Figure 2 is a daily chart with an Elliott Wave count suggesting that the price is topping out in a Wave 3 with a Wave 4 to follow. The price jumped on March 5th to a new high but on a gap, which means that the price should fall to about $22.92 to fill that gap. Once again note the RSI indicator, which although it gave a sell signal on February 27th, has bounced back. Should the RSI give another sell signal, this will be a divergence sell signal, that is where the stock price rises to new high, but the RSI indicator does not exceed the previous high. This is a strong SELL signal. Do note the volume which has been rising, along with the price, a strong positive signal. Finally, do note the JM Internal Band Indicator which has not given a sell signal on February 28th even though the price fell. The JM Internal Band is a simple 15 period moving average offset by 2% positive and 2% negative. I would not be a buyer of ARWR at the present price, preferring to wait for a correction to fill the gap. The share is, however, on my watch list. |
Has been a technical analyst since 1969, and has worked as a futures and options trader with First Financial Futures in Johannesburg, South Africa.
| Address: | 3256 West 24th Ave |
| Vancouver, BC | |
| Phone # for sales: | 6042634214 |
| E-mail address: | petroosp@gmail.com |
Click here for more information about our publications!
PRINT THIS ARTICLE

Request Information From Our Sponsors
- StockCharts.com, Inc.
- Candle Patterns
- Candlestick Charting Explained
- Intermarket Technical Analysis
- John Murphy on Chart Analysis
- John Murphy's Chart Pattern Recognition
- John Murphy's Market Message
- MurphyExplainsMarketAnalysis-Intermarket Analysis
- MurphyExplainsMarketAnalysis-Visual Analysis
- StockCharts.com
- Technical Analysis of the Financial Markets
- The Visual Investor
- VectorVest, Inc.
- Executive Premier Workshop
- One-Day Options Course
- OptionsPro
- Retirement Income Workshop
- Sure-Fire Trading Systems (VectorVest, Inc.)
- Trading as a Business Workshop
- VectorVest 7 EOD
- VectorVest 7 RealTime/IntraDay
- VectorVest AutoTester
- VectorVest Educational Services
- VectorVest OnLine
- VectorVest Options Analyzer
- VectorVest ProGraphics v6.0
- VectorVest ProTrader 7
- VectorVest RealTime Derby Tool
- VectorVest Simulator
- VectorVest Variator
- VectorVest Watchdog
