HOT TOPICS LIST
- MACD
- Fibonacci
- RSI
- Gann
- ADXR
- Stochastics
- Volume
- Triangles
- Futures
- Cycles
- Volatility
- ZIGZAG
- MESA
- Retracement
- Aroon
INDICATORS LIST
LIST OF TOPICS
PRINT THIS ARTICLE
by Donald W. Pendergast, Jr.
Currently in the midst of a stunning 16-month rally, shares of Delta Air Lines may soon reach terminal velocity.
Position: N/A
Donald W. Pendergast, Jr.
Freelance financial markets writer and online publisher of the Trendzetterz.com S&P 500 Weekly Forecast service.
PRINT THIS ARTICLE
FIBONACCI
DAL Reaching Maximum Safe Altitude?
03/06/14 04:07:50 PMby Donald W. Pendergast, Jr.
Currently in the midst of a stunning 16-month rally, shares of Delta Air Lines may soon reach terminal velocity.
Position: N/A
| Technical analysis can be greatly enhanced by the wise use of leading indicators such as Fibonacci retracement and price swing ratio analysis; here's a simple, yet potentially useful "heads up" alert for current longs in shares of Delta Air Lines (DAL) using a monthly and weekly chart. |

|
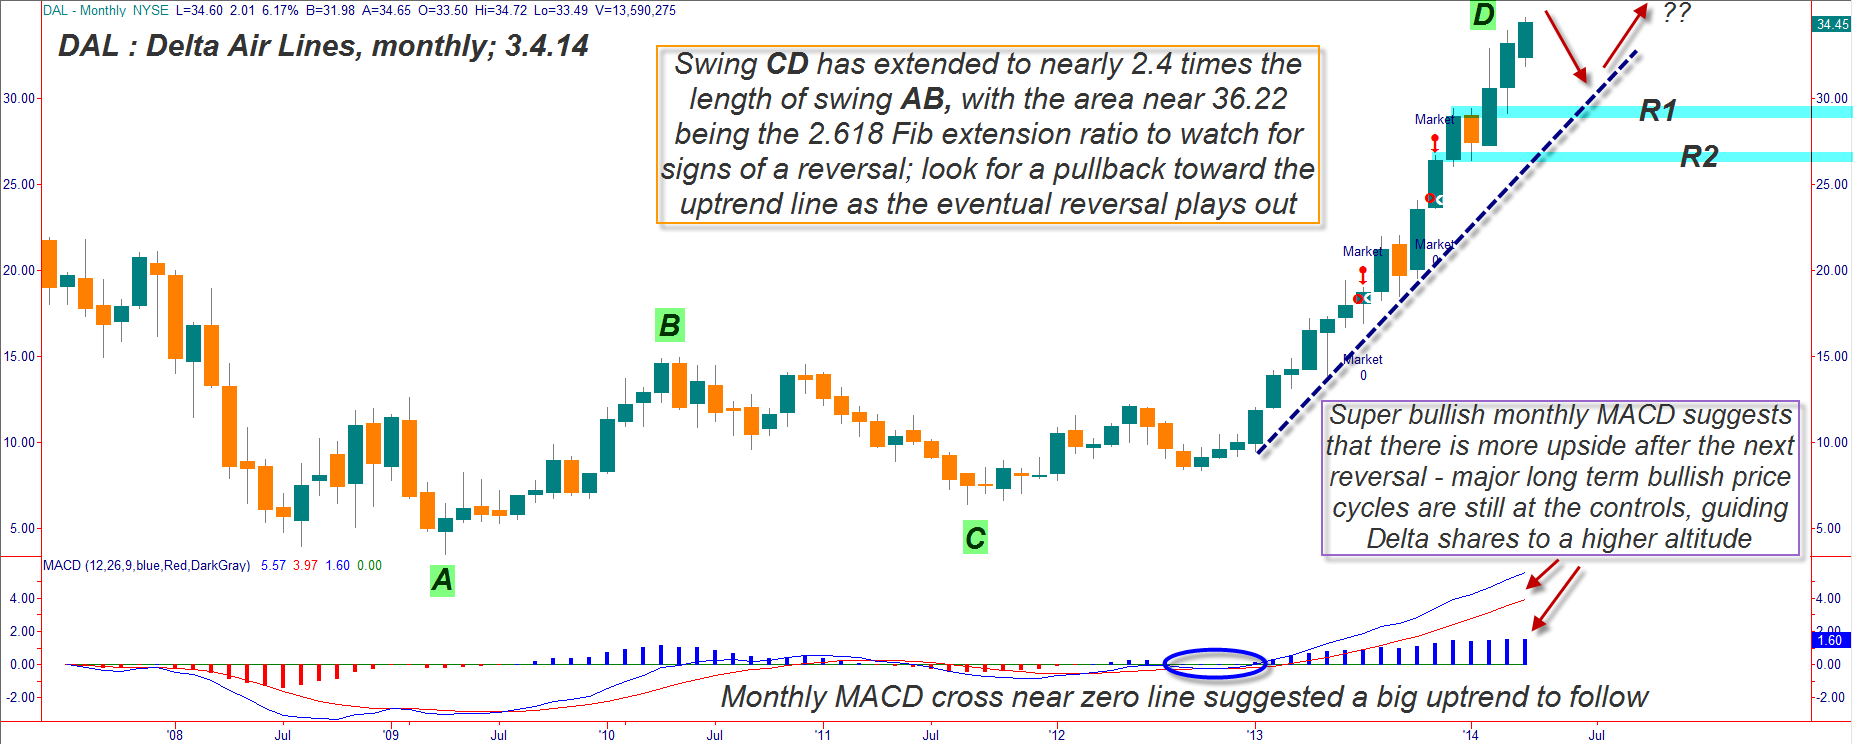
| Figure 1. It's unwise to go short against a powerful uptrend like this one in Delta Air Lines (DAL), but it still pays to be aware of the next logical swing termination point — for swing CD it's at 36.22. |
| Graphic provided by: TradeStation. |
| |
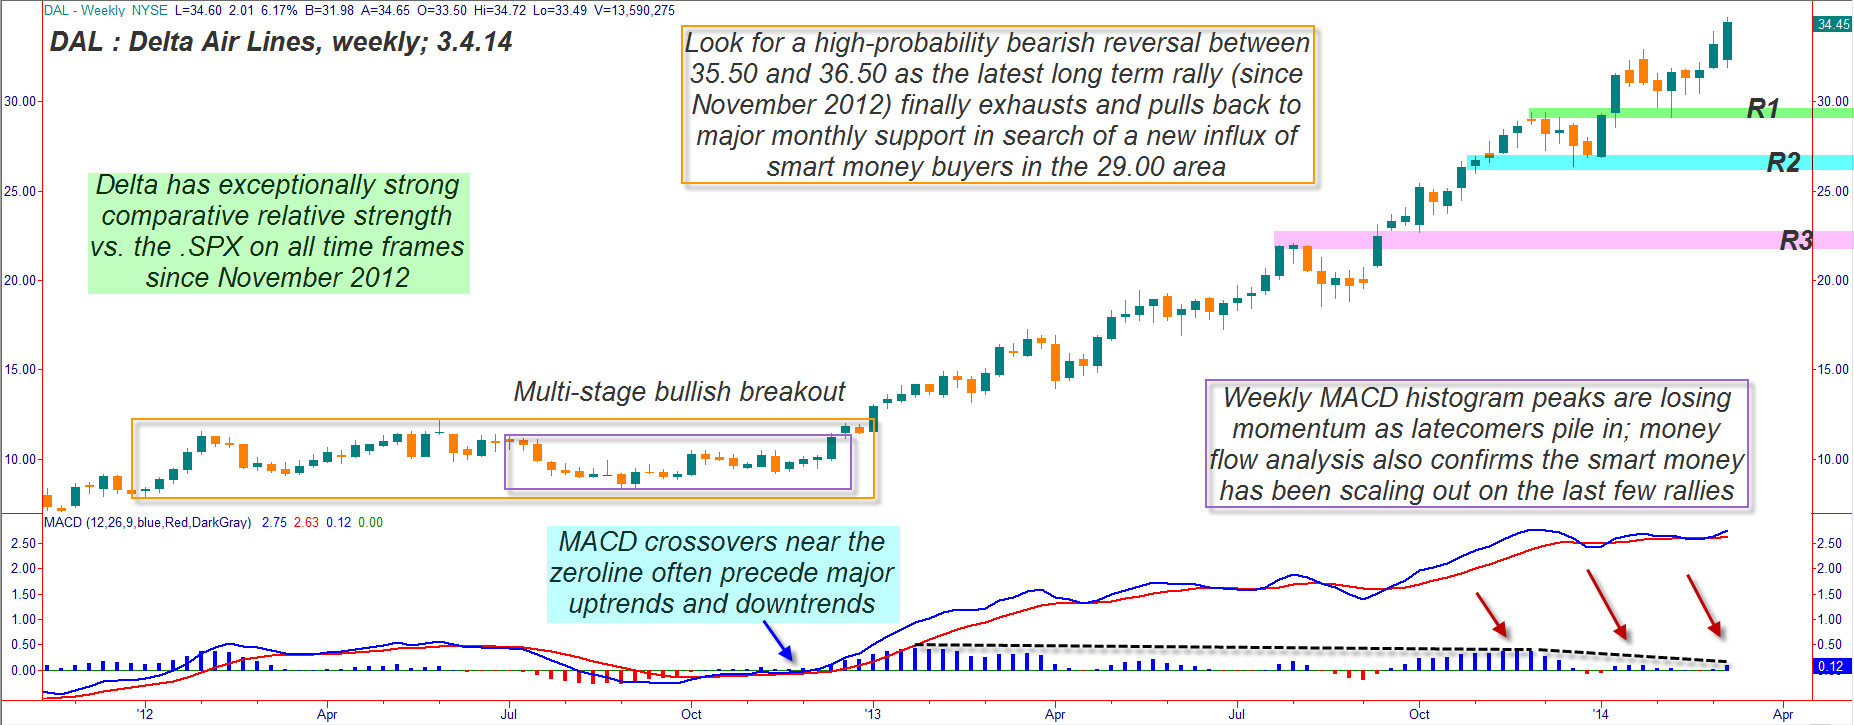
| Anyone familiar with the history of US commercial aviation in the post-WWII era knows that two airlines helped set the stage to help make Atlanta's Hartsfield International airport the busiest (passenger totals) airport in the world; Eastern Airlines and Delta Airlines were the two major carriers that funneled massive amounts of connecting flights through Atlanta, beginning in the early 1960s. Eastern went bankrupt around 1989-1990 (a major casualty of airline deregulation and the savage airline ticket price wars that erupted in the 1980s) and that pushed even more Florida and Caribbean/Latin America traffic into Delta's system, setting the stage for the nonstop growth of this gigantic, world-class airport over the past 25 years. But even DAL shares get hammered from time to time as oil prices surge, recessions/depressions arrive, and airline ticket price wars erupt on short notice. But even with oil prices at above average levels, DAL shares are up by 312% since October 2012 and the monthly and weekly charts — at first glance — are exceptionally bullish looking. But a savvy technician is always one step ahead of the market, forecasting high probability price swing reversal zones, price cycles, and support/resistance zones in the markets they analyze and trade. And right now, a doozy of a looming reversal zone is coming into focus on DAL's monthly chart (Figure 1): 1. Swing AB will equal 2.618 times the length of swing CD at a price that is only $1.50 higher than Tuesday's high of 34.72 (36.22). 2. The monthly MACD histogram, although still very bullish (high momentum) isn't much higher than it was back at the April 2010 swing high; unless this changes soon, assume that this rally is starting to fade. 3. The weekly chart for DAL (Figure 2) reveals an alarming loss of upside momentum on its own MACD histogram. 4. Long-term money flow analysis also shows that the "smart money" has been selling out of their long positions over the past four to six months, with latecomers being the ones doing the bulk of the buying on the last few weekly chart rallies. There are bullish confirmations on the monthly chart, however, and these bode well for a continuation move higher after a proportional correction back down toward the blue uptrend line; note the super-wide spread of the MACD signal line and average (blue and red lines). Unless a major market meltdown is due soon, once DAL pulls back toward that trend line near the 29.00 to 31.00 level, a strong daily/weekly time frame bounce should occur, allowing skilled swing traders to once again cash in on this Peach State hi-flier stock. |

|
| Figure 2. Note the two-stage bullish consolidation range breakout in DAL that occurred right after a MACD zero line crossover. MACD histogram momentum is fading fast as of early March 2014, however. |
| Graphic provided by: TradeStation. |
| |
| Presently, going long DAL here is only for those with no fear of flying at ultra-high stock market altitudes; it's best to wait for the aforementioned monthly chart pullback before plunking cash down to buy the stock again. Existing longs in DAL need to be using protective puts and/or a close trailing stop (for example, a one-week trailing stop) to protect their portfolios from a sudden stall and reversal in DAL. FYI, be on guard against a sudden reversal on Southwest Airlines (LUV) as well, using suitable protection on any long positions you also have in that stock. Trade wisely until we meet here again. |
Freelance financial markets writer and online publisher of the Trendzetterz.com S&P 500 Weekly Forecast service.
| Title: | Market consultant and writer |
| Company: | Trendzetterz |
| Address: | 81 Hickory Hollow Drive |
| Crossville, TN 38555 | |
| Phone # for sales: | 904-303-4814 |
| Website: | trendzetterz.com |
| E-mail address: | support@trendzetterz.com |
Traders' Resource Links | |
| Trendzetterz has not added any product or service information to TRADERS' RESOURCE. | |
Click here for more information about our publications!
PRINT THIS ARTICLE

Request Information From Our Sponsors
- StockCharts.com, Inc.
- Candle Patterns
- Candlestick Charting Explained
- Intermarket Technical Analysis
- John Murphy on Chart Analysis
- John Murphy's Chart Pattern Recognition
- John Murphy's Market Message
- MurphyExplainsMarketAnalysis-Intermarket Analysis
- MurphyExplainsMarketAnalysis-Visual Analysis
- StockCharts.com
- Technical Analysis of the Financial Markets
- The Visual Investor
- VectorVest, Inc.
- Executive Premier Workshop
- One-Day Options Course
- OptionsPro
- Retirement Income Workshop
- Sure-Fire Trading Systems (VectorVest, Inc.)
- Trading as a Business Workshop
- VectorVest 7 EOD
- VectorVest 7 RealTime/IntraDay
- VectorVest AutoTester
- VectorVest Educational Services
- VectorVest OnLine
- VectorVest Options Analyzer
- VectorVest ProGraphics v6.0
- VectorVest ProTrader 7
- VectorVest RealTime Derby Tool
- VectorVest Simulator
- VectorVest Variator
- VectorVest Watchdog
