

HOT TOPICS LIST
- MACD
- Fibonacci
- RSI
- Gann
- ADXR
- Stochastics
- Volume
- Triangles
- Futures
- Cycles
- Volatility
- ZIGZAG
- MESA
- Retracement
- Aroon
INDICATORS LIST
LIST OF TOPICS
PRINT THIS ARTICLE
by Donald W. Pendergast, Jr.
The S&P 500 index may be setting up for its next swing trade move - down toward the 1,810.00 level.
Position: N/A
Donald W. Pendergast, Jr.
Freelance financial markets writer and online publisher of the Trendzetterz.com S&P 500 Weekly Forecast service.
PRINT THIS ARTICLE
TECHNICAL ANALYSIS
SPY: Bearish On Two Key Intraday Time Frames
03/05/14 02:52:57 PMby Donald W. Pendergast, Jr.
The S&P 500 index may be setting up for its next swing trade move - down toward the 1,810.00 level.
Position: N/A
| It has been said that major market tops take longer to form than major market bottoms, and if the S&P 500 index (.SPX, SPY, @ES) and friends (QQQ, IWM, MDY and DIA) are indeed in the final stages of the epic, five-year old bull market rally that ensued after the 2007-2009 market debacles, then these markets truly are taking their sweet time in forming the final upper resistance barrier that will mark the price level at which the "greater fool" principle will have ultimately played out. To a seasoned technician's eye, the price action in .SPX/SPY since the summer of 2013 confirms that the "smart money" are divesting themselves of their long positions, with the latecomer "dumb money" crowd being the ones unwittingly enlisted into the role of the dupe or patsy prior to a lengthy market decline. While it's valuable to know the "big picture" in the .SPX, it's even more important to be aware of key intraday price action that may signal to start of such a major decline — after all, the strongest daily, weekly, and monthly chart trends all begin with seemingly innocuous breakouts on 5-,15-, 30-,60-, and 180-minute charts first, and that may be what's going on in the 60- and 180-minute charts on the SPY right now. Here's a closer look. |
|
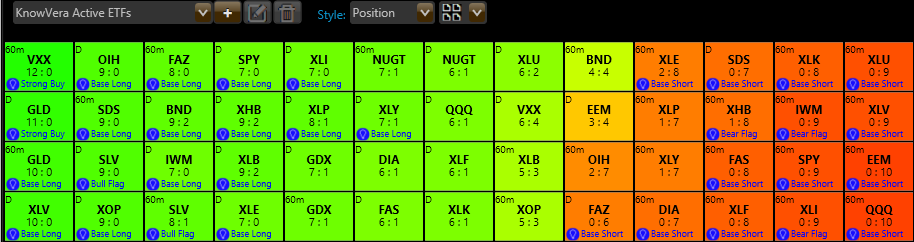
| Figure 1. SPY is setting up as a potential 'base short' trade on its 60-minute time frame. IWM, QQQ and numerous sector ETF's are also bearish on their hourly time frames. |
| Graphic provided by: Phantom Trader by KnowVera Research LLC. |
| |
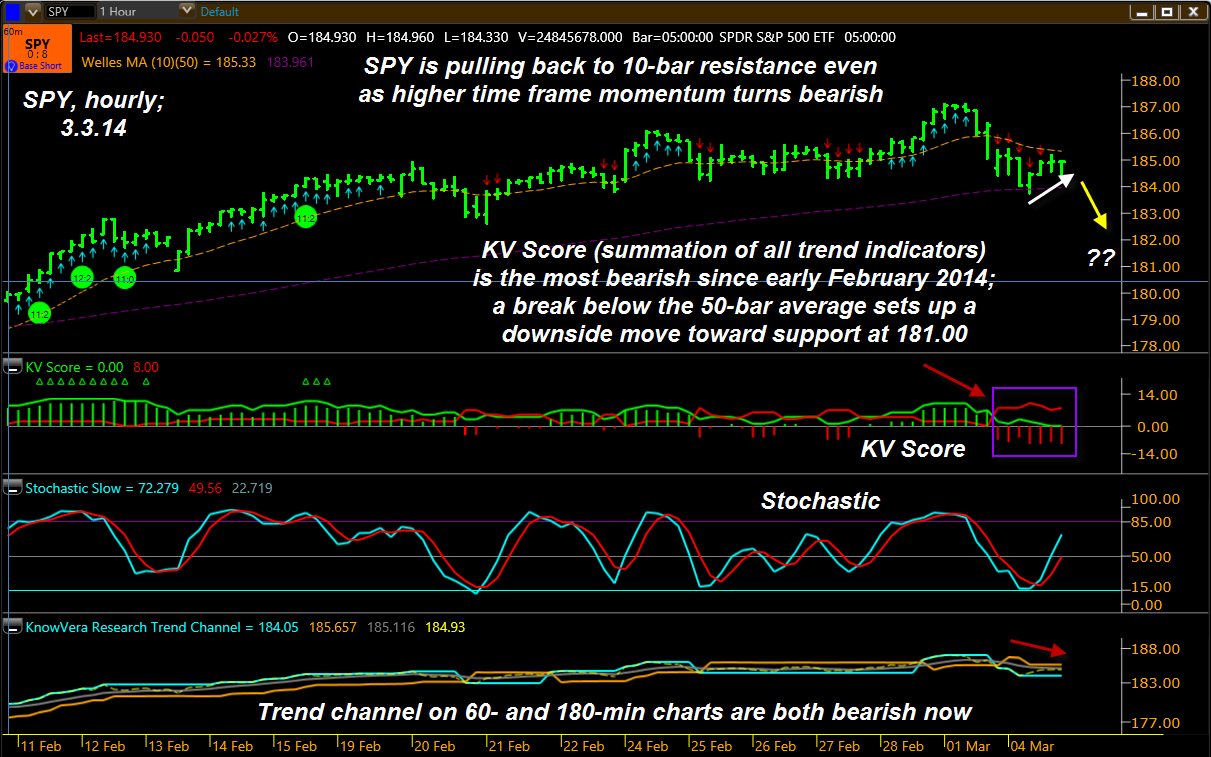
| The Trend Monitor within Phantom Trader is a good place to begin the search for suitable, low-risk, high probability trade setups (long or short) and there is one setup that is well suited for those traders who like to enter a position on a pullback against a higher degree trend (typically three to five degrees higher, as in five and 15 minutes, 60-, and 180-minutes or even by using a daily/weekly or weekly/monthly pair of charts to identify such setups (Figure 1). Scanning the list of actively traded ETFs under the 'position' tab reveals that SPY is setting up as a 'base long' candidate, one that has a trend score of 0:8 (bearish). Clicking on the cell for the ETF brings up its hourly chart, one which clearly reveals the following: 1. SPY is bouncing higher off its 50-bar average and appears to be experiencing resistance on the pullback as it reaches its down sloping 10-bar average (gold line). 2. The trend channel (bottom pane) just turned bearish as did the KV Score histogram; the histogram is the most bearish it has been in four weeks, FYI. 3. ADX and MACD (not shown) are also confirming a strengthening downtrend. 4. The 180-minute chart for SPY (not shown) has just completed a bearish trend channel crossover, confirming the validity of Monday's sell-off. All in all, the above technical actions make a strong case for the SPY's line of least resistance to be toward lower valuations in the very near term; here are the key price levels to watch in SPY: A. 183.75 (the low on 3.3.14); a breach to the downside on big volume sets the stage for a move to the next support near 181.00, probably in just a few days time after such a break. B. If that sell-off happens as anticipated, look to see if big buyers come to the rescue near 181.00 — or not. As always, volume and money flow and divergence patterns near key support resistance levels are the main things to watch for when looking for a reversal. C. Finally, look to see if SPY is able to blast back above its hourly 10-bar average on big volume. If that happens prior to any dip toward 183.75, well it means we've all been fooled again and the topping "game" is still on in the major US stock indexes. |
|
| Figure 2. SPY's hourly chart KV Score is the most bearish it's been since early February 2014; note the support/resistance price action near the 50- and 10-bar moving averages. |
| Graphic provided by: Phantom Trader by KnowVera Research LLC. |
| |
| This may or may not be "the" critical turning point for the .SPX after a 5-year run higher, but it still appears to be a good short pullback trade setup; a strong hourly chart reversal bar off the 10-bar average may just be the ticket to further drops to the 183.75/181.00 areas. Trade wisely until we meet here again. |
Freelance financial markets writer and online publisher of the Trendzetterz.com S&P 500 Weekly Forecast service.
| Title: | Market consultant and writer |
| Company: | Trendzetterz |
| Address: | 81 Hickory Hollow Drive |
| Crossville, TN 38555 | |
| Phone # for sales: | 904-303-4814 |
| Website: | trendzetterz.com |
| E-mail address: | support@trendzetterz.com |
Traders' Resource Links | |
| Trendzetterz has not added any product or service information to TRADERS' RESOURCE. | |
Click here for more information about our publications!
Comments
Date:�03/05/14Rank:�5Comment:�
Date:�03/06/14Rank:�1Comment:�another idiot trying to call a top.

Request Information From Our Sponsors
- StockCharts.com, Inc.
- Candle Patterns
- Candlestick Charting Explained
- Intermarket Technical Analysis
- John Murphy on Chart Analysis
- John Murphy's Chart Pattern Recognition
- John Murphy's Market Message
- MurphyExplainsMarketAnalysis-Intermarket Analysis
- MurphyExplainsMarketAnalysis-Visual Analysis
- StockCharts.com
- Technical Analysis of the Financial Markets
- The Visual Investor
- VectorVest, Inc.
- Executive Premier Workshop
- One-Day Options Course
- OptionsPro
- Retirement Income Workshop
- Sure-Fire Trading Systems (VectorVest, Inc.)
- Trading as a Business Workshop
- VectorVest 7 EOD
- VectorVest 7 RealTime/IntraDay
- VectorVest AutoTester
- VectorVest Educational Services
- VectorVest OnLine
- VectorVest Options Analyzer
- VectorVest ProGraphics v6.0
- VectorVest ProTrader 7
- VectorVest RealTime Derby Tool
- VectorVest Simulator
- VectorVest Variator
- VectorVest Watchdog