HOT TOPICS LIST
- MACD
- Fibonacci
- RSI
- Gann
- ADXR
- Stochastics
- Volume
- Triangles
- Futures
- Cycles
- Volatility
- ZIGZAG
- MESA
- Retracement
- Aroon
INDICATORS LIST
LIST OF TOPICS
PRINT THIS ARTICLE
by Donald W. Pendergast, Jr.
The April 2014 crude oil futures contract has completed a successful - and powerful - bullish breakout on its hourly time frame.
Position: N/A
Donald W. Pendergast, Jr.
Freelance financial markets writer and online publisher of the Trendzetterz.com S&P 500 Weekly Forecast service.
PRINT THIS ARTICLE
BREAKOUTS
Crude Oil: Hourly Chart Breakout
03/04/14 04:40:50 PMby Donald W. Pendergast, Jr.
The April 2014 crude oil futures contract has completed a successful - and powerful - bullish breakout on its hourly time frame.
Position: N/A
| NYMEX crude oil futures (April '14 contract) are up by 15% in the past eight weeks and are setting up for yet another move higher after an impressive breakout on its 60-minute chart; nimble, well-capitalized swing traders would do well to examine this potential long trade setup, one that appears to offer more upside potential than downside risk. Here's a closer look. |

|
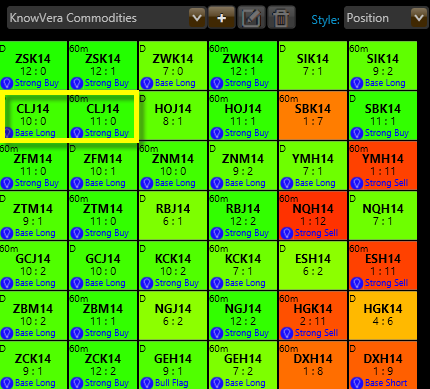
| Figure 1. NYMEX April 2014 Crude Oil (CLJ14) is experiencing strongly bullish price action on both its 60-minute and daily time frames. |
| Graphic provided by: Phantom Trader by KnowVera Research LLC. |
| |
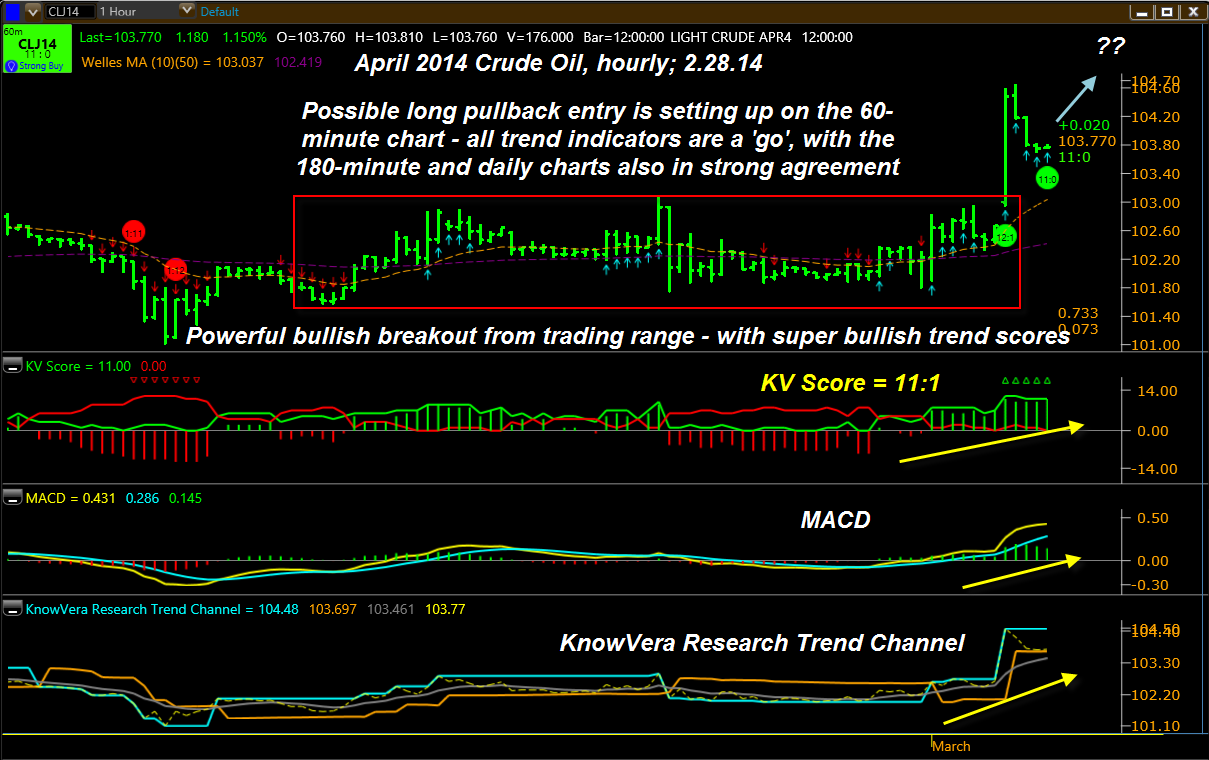
| Crude oil futures are among the most widely traded, universally watched commodity markets in the world — easily as capable of making sustained intraday swing moves as they are able of producing powerful multimonth (year) trend-following mega-moves. At other times the trading action can be choppy, usually until a significant support/resistance level is decisively breached, after which a strong swing move will emerge out of a chaotic consolidation zone. That's what has just happened on crude's hourly chart of the April '14 contract, setting up a low risk, high reward, long swing trade entry worthy of any serious trader's attention. Here are the primary items of interest for those bullish on near-term crude oil futures: 1. The primary trend of the hourly, daily, and weekly contracts are all in bullish mode — with the weekly chart just crossing to the upside (Figure 2). 2. The average directional movement index (ADX) is rising on all three of those time frames. 3. All three time frames have bullish KV trend scores of 11:1, 10:1 and 8:2, respectively, with the daily and weekly charts also confirming 'base long' chart patterns that also imply more upside potential. 4. The hourly (60-minute) chart for CLJ14 reveals an impressive bullish leap higher out of a multiday trading range (rectangle on price bars); also note the extreme wide range of the breakout bar and its trend score green dot on the chart, one that has an uber-bullish 12:1 trend score. Some breakouts fail after a lukewarm attempt at a breakout, but there can be little doubt here regarding crude's near-term price direction intentions, especially given the confirmed bullish trend indicators on the contract's daily and weekly charts. Note the normal pullback toward key support following the massive surge on the break; typically, a successful breakout will drift back toward, if not actually touch, its 10-bar simple moving average (gold dashed line) before reversing to move in the same direction as the initial breakout thrust. |

|
| Figure 2. CLJ14's hourly chart reveals an ultra-wide range bullish breakout bar, one that has a trend score of 12:1, one of the highest rankings possible. A pullback toward the gold 10-bar average sets up a low risk, high potential long trade. |
| Graphic provided by: Phantom Trader by KnowVera Research LLC. |
| |
| Trading April crude futures here is very basic; watch the 60-minute chart for signs of a fresh bullish surge and then go long on a break above the hourly bar that confirms a new upswing is underway. Once in the position, set your initial stop several ticks below the ultimate low of the current pullback and look to scale out or sell out of your trade if 104.98 is reached, using a two to three bar trailing stop of the hourly lows to manage the trade. There is strong weekly chart resistance at 105.03 and you don't want to be overstaying your welcome on an hourly chart trade with such a major resistance zone only $1.00 or so above your long entry point. For traders skilled with futures options, you might also want to consider selling out of the money puts (with a strike price of 90.00 or less) and look to make some quick cash that way as time decay and powerful bullish trend forces combine to keep the puts out of the money — and the cash in your pockets — at least if crude's weekly uptrend is just getting going now. Regardless of the way you choose to play April '14 crude, just make sure you keep your account risk small and your profit and risk control exit points always in view at all times. Trade wisely until we meet here again. |
Freelance financial markets writer and online publisher of the Trendzetterz.com S&P 500 Weekly Forecast service.
| Title: | Market consultant and writer |
| Company: | Trendzetterz |
| Address: | 81 Hickory Hollow Drive |
| Crossville, TN 38555 | |
| Phone # for sales: | 904-303-4814 |
| Website: | trendzetterz.com |
| E-mail address: | support@trendzetterz.com |
Traders' Resource Links | |
| Trendzetterz has not added any product or service information to TRADERS' RESOURCE. | |
Click here for more information about our publications!
Comments

Request Information From Our Sponsors
- StockCharts.com, Inc.
- Candle Patterns
- Candlestick Charting Explained
- Intermarket Technical Analysis
- John Murphy on Chart Analysis
- John Murphy's Chart Pattern Recognition
- John Murphy's Market Message
- MurphyExplainsMarketAnalysis-Intermarket Analysis
- MurphyExplainsMarketAnalysis-Visual Analysis
- StockCharts.com
- Technical Analysis of the Financial Markets
- The Visual Investor
- VectorVest, Inc.
- Executive Premier Workshop
- One-Day Options Course
- OptionsPro
- Retirement Income Workshop
- Sure-Fire Trading Systems (VectorVest, Inc.)
- Trading as a Business Workshop
- VectorVest 7 EOD
- VectorVest 7 RealTime/IntraDay
- VectorVest AutoTester
- VectorVest Educational Services
- VectorVest OnLine
- VectorVest Options Analyzer
- VectorVest ProGraphics v6.0
- VectorVest ProTrader 7
- VectorVest RealTime Derby Tool
- VectorVest Simulator
- VectorVest Variator
- VectorVest Watchdog
