HOT TOPICS LIST
- MACD
- Fibonacci
- RSI
- Gann
- ADXR
- Stochastics
- Volume
- Triangles
- Futures
- Cycles
- Volatility
- ZIGZAG
- MESA
- Retracement
- Aroon
INDICATORS LIST
LIST OF TOPICS
PRINT THIS ARTICLE
by Koos van der Merwe
Whenever I receive a buy signal from a program I use to analyze the markets, I always do my due diligence before buying the stock.
Position: Buy
Koos van der Merwe
Has been a technical analyst since 1969, and has worked as a futures and options trader with First Financial Futures in Johannesburg, South Africa.
PRINT THIS ARTICLE
ELLIOTT WAVE
Verisign Inc.
03/04/14 04:35:11 PMby Koos van der Merwe
Whenever I receive a buy signal from a program I use to analyze the markets, I always do my due diligence before buying the stock.
Position: Buy
| For more than 15 years, VeriSign (VRSN) has maintained 100 percent operational accuracy and stability for .com and .net, keeping the world connected online, seamlessly and securely. Today the company continues to play a central role in the expansion and protection of the Internet, working continuously to improve and evolve its infrastructure as threats and usage continue to increase dramatically. On February 6, 2014 the company reported financial results for the fourth quarter of 2013 and year ended December 31, 2013. They stated that the year 2013 was a strong year for the company capped by a solid performance, with double digit revenue growth, increased cash flow, and expanded margins. They also returned $1 billion to shareholders in share repurchases. Everything looked good, so why did the share price drop? Probably speculators, taking profits. |

|
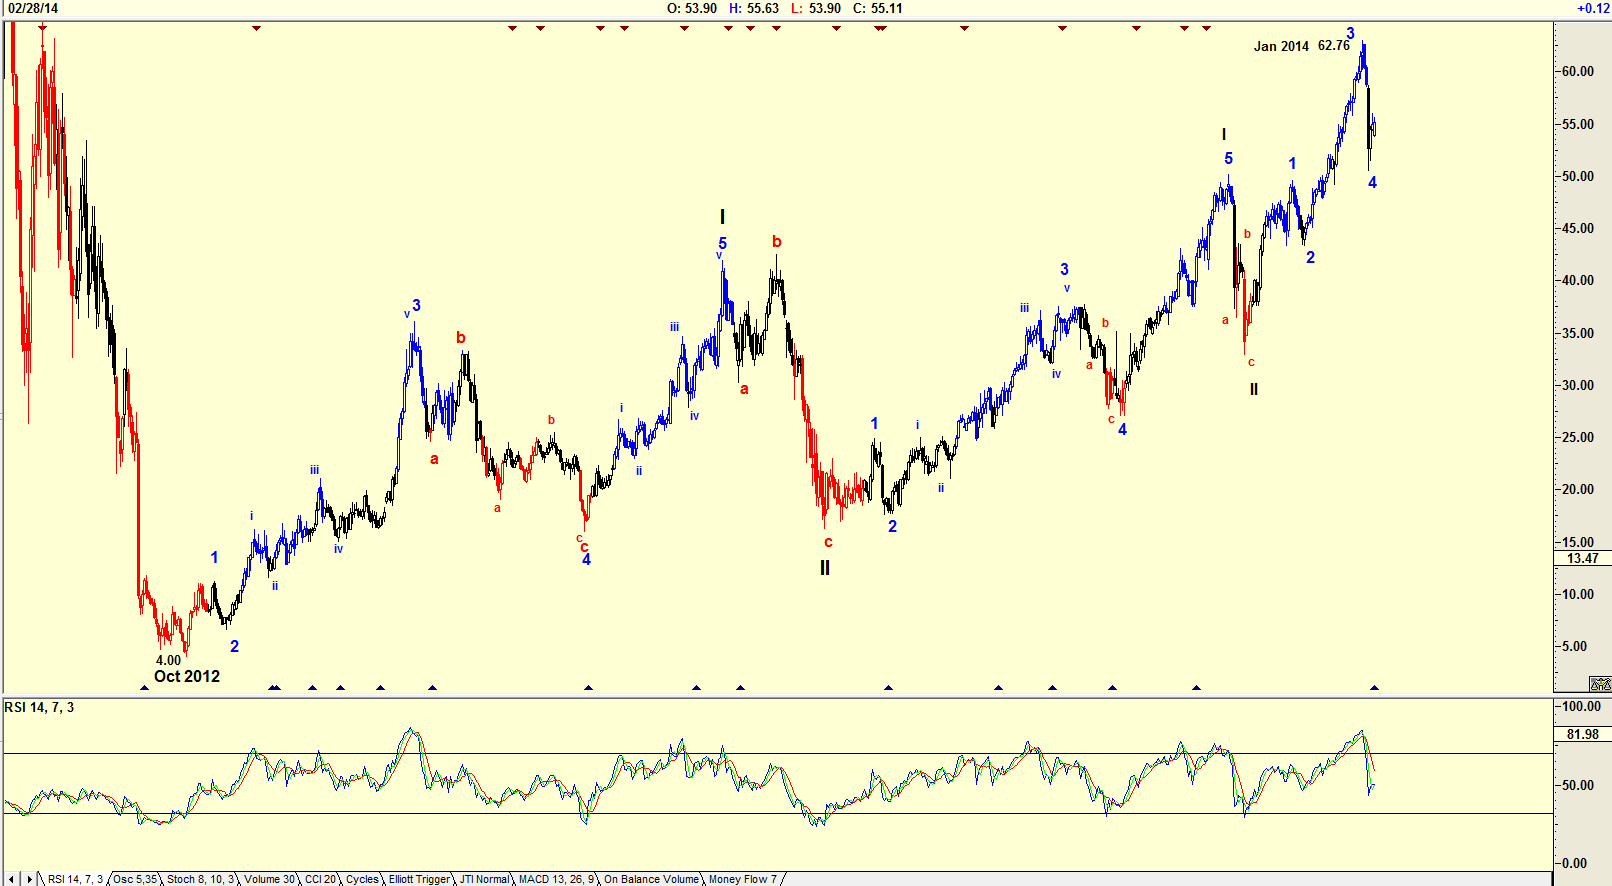
| Figure 1. Weekly Chart with Elliott Wave count suggesting a target. |
| Graphic provided by: AdvancedGET. |
| |
| The weekly chart in Figure 1 shows an Elliott Wave count that could be acceptable. I say "could be" because you should never forget that an Elliott Wave is a signpost in the wilderness, and that signpost can change direction and the wave count a little way down the road. At the moment however, that signpost is suggesting that the share price could rise in a wave 5 of a Wave III of a major WAVE III. The negative is the RSI(14) indicator, which is suggesting a further correction. I must add that the share price has performed incredibly well since the collapse into October 2012, rising from a low of $4.00 to a high of $62.76 by January 2014. |

|
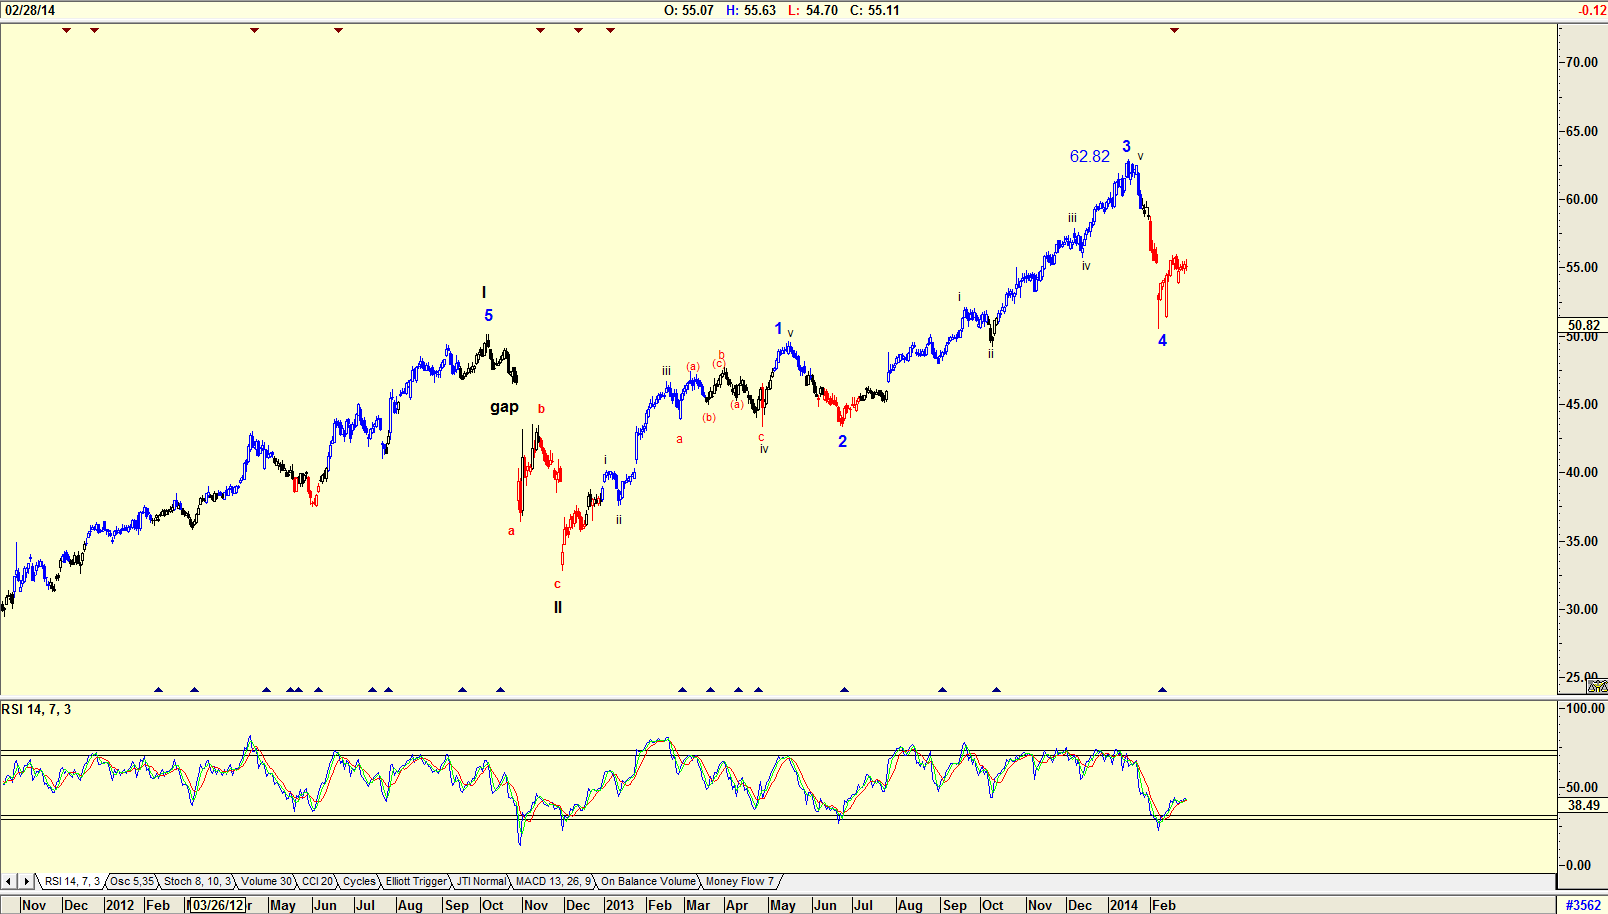
| Figure 2. Daily chart showing an RSI buy for a 5th wave up. |
| Graphic provided by: AdvancedGET. |
| |
| Looking at the daily chart of VRSN in Figure 2, we see that the Elliott Wave count has completed Wave 4 of WAVE III. The RSI indicator is also suggesting that the share price should rise to at least $62.82, the high of wave 3. |

|
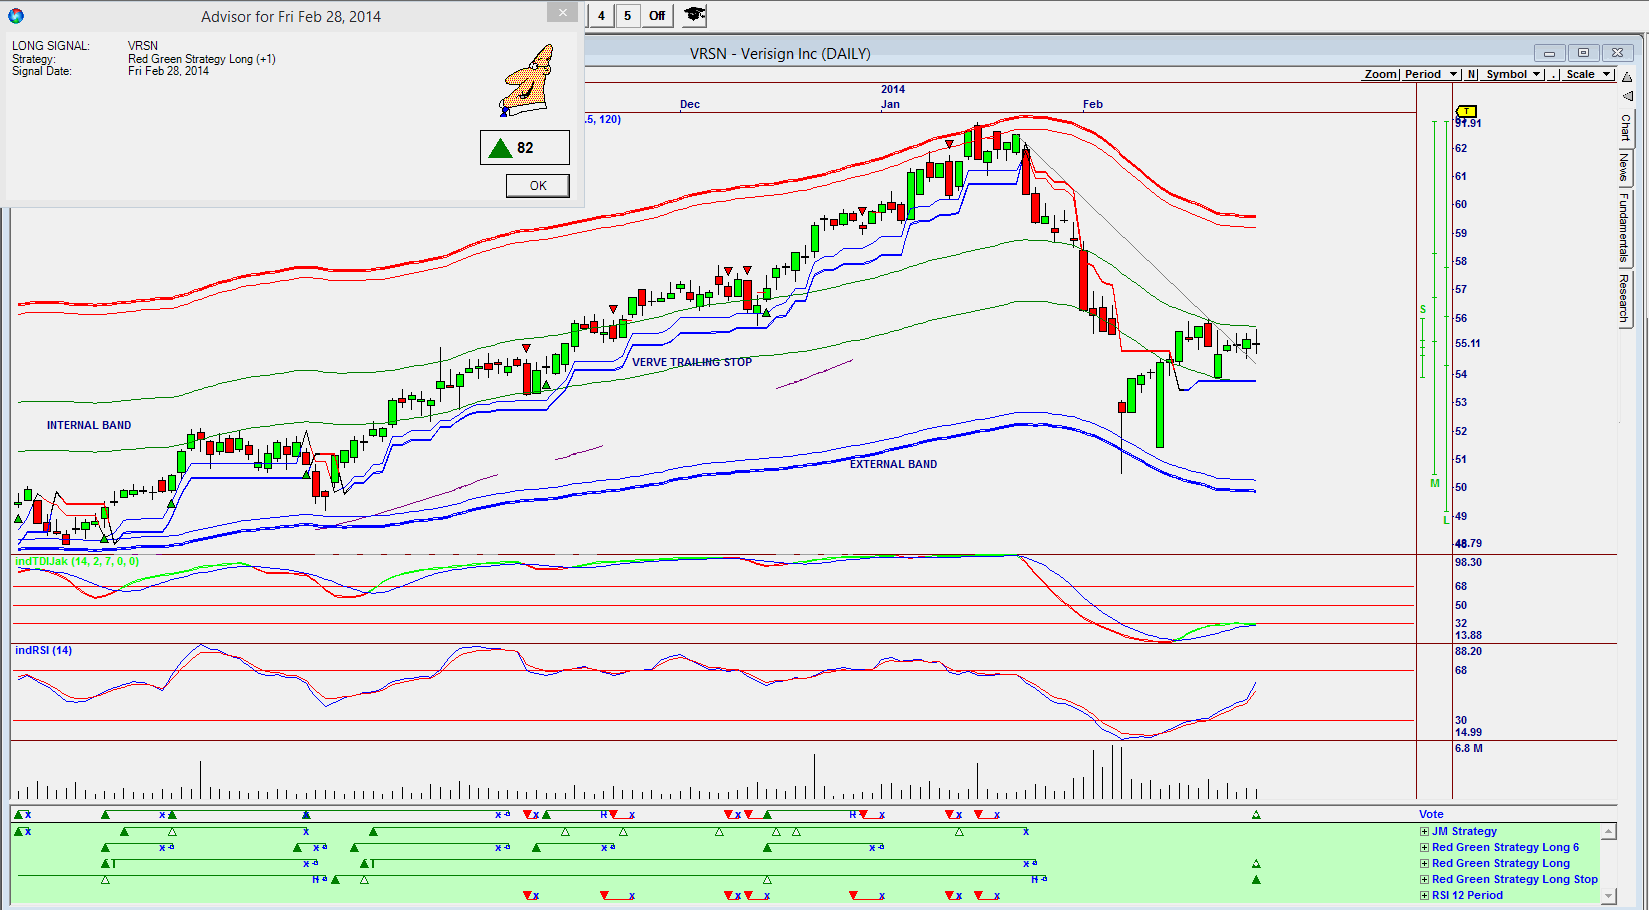
| Figure 3. An Omnitrader chart with a Vote line buy on an Advisor rating of 82. |
| Graphic provided by: Omnitrader. |
| |
| The final chart is the Omnitrader chart that triggered a buy signal on the Vote line. The buy signal is the summation of the two strategies, Red Green Long and Red Green Long stop shown below the vote line. The Advisor rating for February 28, 2014 is 82, which is very strong. Note that the share price on the chart has broken above the Verve trailing stop and is presently moving with the internal band. Also note the two indicators. Both are in buy mode. Without any doubt, I would be a buyer of VRSN at present levels. |
Has been a technical analyst since 1969, and has worked as a futures and options trader with First Financial Futures in Johannesburg, South Africa.
| Address: | 3256 West 24th Ave |
| Vancouver, BC | |
| Phone # for sales: | 6042634214 |
| E-mail address: | petroosp@gmail.com |
Click here for more information about our publications!
PRINT THIS ARTICLE

Request Information From Our Sponsors
- StockCharts.com, Inc.
- Candle Patterns
- Candlestick Charting Explained
- Intermarket Technical Analysis
- John Murphy on Chart Analysis
- John Murphy's Chart Pattern Recognition
- John Murphy's Market Message
- MurphyExplainsMarketAnalysis-Intermarket Analysis
- MurphyExplainsMarketAnalysis-Visual Analysis
- StockCharts.com
- Technical Analysis of the Financial Markets
- The Visual Investor
- VectorVest, Inc.
- Executive Premier Workshop
- One-Day Options Course
- OptionsPro
- Retirement Income Workshop
- Sure-Fire Trading Systems (VectorVest, Inc.)
- Trading as a Business Workshop
- VectorVest 7 EOD
- VectorVest 7 RealTime/IntraDay
- VectorVest AutoTester
- VectorVest Educational Services
- VectorVest OnLine
- VectorVest Options Analyzer
- VectorVest ProGraphics v6.0
- VectorVest ProTrader 7
- VectorVest RealTime Derby Tool
- VectorVest Simulator
- VectorVest Variator
- VectorVest Watchdog
