

HOT TOPICS LIST
- MACD
- Fibonacci
- RSI
- Gann
- ADXR
- Stochastics
- Volume
- Triangles
- Futures
- Cycles
- Volatility
- ZIGZAG
- MESA
- Retracement
- Aroon
INDICATORS LIST
LIST OF TOPICS
PRINT THIS ARTICLE
by Donald W. Pendergast, Jr.
Facebook shares have traced out a compelling five wave Elliot pattern over the past 18 months and may be due for a correction.
Position: N/A
Donald W. Pendergast, Jr.
Freelance financial markets writer and online publisher of the Trendzetterz.com S&P 500 Weekly Forecast service.
PRINT THIS ARTICLE
ELLIOTT WAVE
Facebook: Fifth Wave Up Nearing Completion?
02/28/14 05:43:34 PMby Donald W. Pendergast, Jr.
Facebook shares have traced out a compelling five wave Elliot pattern over the past 18 months and may be due for a correction.
Position: N/A
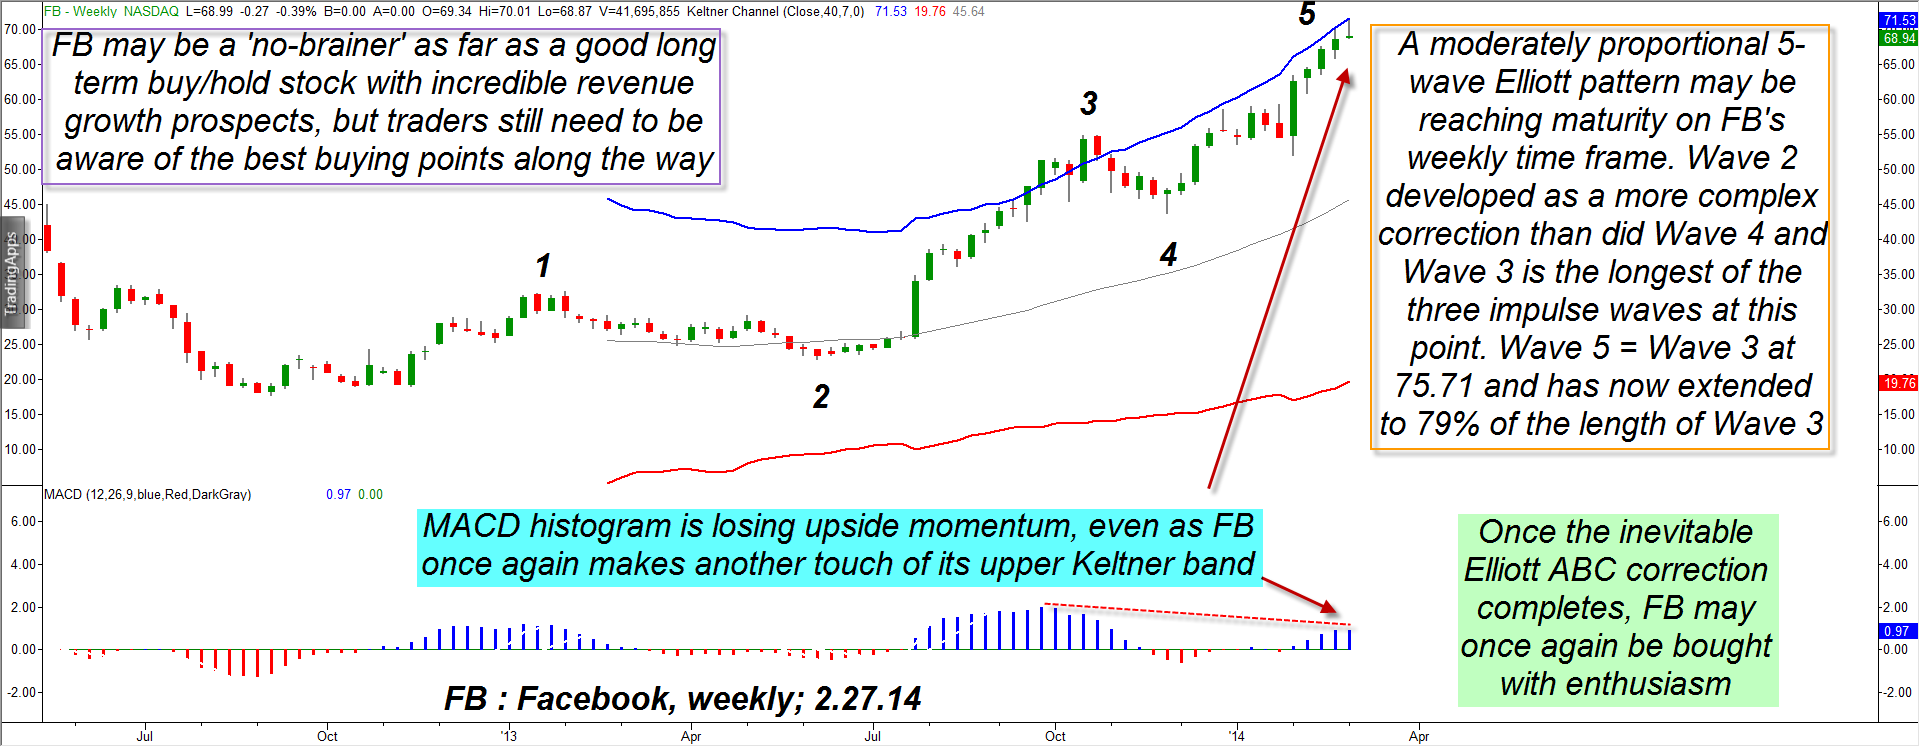
| Facebook (FB) shares have been on fire since making a major bullish breakout last summer — its 20%-plus bullish gap of July 25, 2013 was truly the "all-clear" signal that individual investors and institutions alike were waiting for, and which lit the fire for a powerful Elliott third wave. Now that five waves up have printed on FB's weekly chart, it's a good time for existing longs in this super-growth stock to take action to protect their gains and for speculative bears to be alert for the tell-tale signs of an upcoming trend reversal. Here's a closer look. |
|
| Figure 1. Facebook's (FB) five wave Elliott advance may be getting close to a logical termination zone; expect a proportional ABC corrective wave pattern to unfold over the next several months. |
| Graphic provided by: TradeStation. |
| |
| You don't necessarily have to be a bona fide Elliott Wave expert to identify meaningful (and potentially profitable) chart patterns and wave relationships; this weekly graph of FB is testimony enough of that. Major uptrends/downtrends sometimes unfold in well-proportioned 5-wave structures that exhibit the following characteristics: 1. Wave 3 is the longest of the three impulse waves. 2. Wave 4 does not dip below the Wave 1 high. 3. Wave 2 and Wave 4 will typically correct in different patterns, for example, the Wave 2 correction here is longer and more drawn out (complex) that the Wave 4 correction (simple). 4. There is frequently a Fibonacci relationship between the length of the various swings; at present, Wave 5 is approximately 79% of the length of Wave 3 and it's not uncommon to see a fifth wave terminate at a .618, .786 or 1.00 (equal) the length of Wave 3. In this example of FB, note how strong the MACD histogram was at the Wave 3 high in October 2013 — far higher than it was at the Wave 1 high in February 2013. This was a tip-off to skilled Elliott traders that the Wave 4 correction was likely to be shallow, thus setting the stage for a possible fifth wave advance. That Wave 3 also blasted above the upper Keltner channel (set at seven average true ranges (ATR) away from a 40-bar moving average) and even managed to trade above it for more than a month before correcting was also a powerful confirmation that FB might yet experience a full five wave pattern to the upside before correcting in a major way. |
|
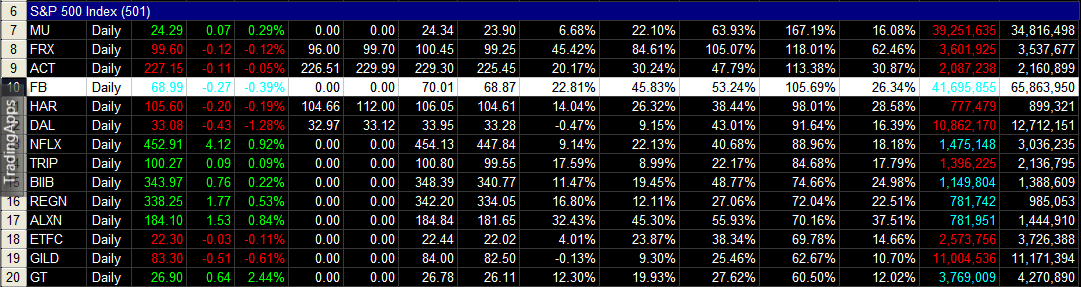
| Figure 2. FB's comparative relative strength numbers versus the S&P 500 index (.SPX, SPY) are impressive; it's been outperforming the .SPX by a factor of 105.69% over the past 52 weeks. |
| Graphic provided by: TradeStation. |
| Graphic provided by: TradeStation RadarScreen. |
| |
| Of major interest to existing FB longs right now is that the stock, although still enjoying a powerful fifth wave rally, has so far failed to power above the upper band and is also losing upside momentum — as confirmed by its substantially lower MACD histogram peak this time around. This strongly suggests that the "smart money" are steadily selling out to latecomers and that an Elliott ABC corrective wave sequence should appear soon. Not surprisingly, a glance at FB's daily chart (not shown) indeed confirms that distribution is well underway. This by no means indicates a 'crash' is imminent in FB shares, but it does strongly suggest that its current five-wave advance is rapidly running out of professional buying 'fuel' (investment fund cash, and lots of it) and that the current latecomers into the stock may be about to be sheared as the stock tops and corrects proportionally against the longer term uptrend. Current owners of FB need to be using protective puts and/or a close trailing stop (or both) and may also consider taking some profits for the swing trading portion of their holdings as this move finally exhausts. Speculative bears may want to buy puts with three to four months of time value if they see last week's low of 65.73 taken out on strong weekly volume; the next major support for FB is near the 59.00 to 60.00 area and that might be a great place to take profits to limit the risk of a short-covering rally. FB has truly great long-term earnings and revenue growth potential and the big money players are well aware of that; don't overstay your welcome on any profitable short trades you may make in FB and you'll save yourself some real aggravations. Trade wisely until we meet here again. |
Freelance financial markets writer and online publisher of the Trendzetterz.com S&P 500 Weekly Forecast service.
| Title: | Market consultant and writer |
| Company: | Trendzetterz |
| Address: | 81 Hickory Hollow Drive |
| Crossville, TN 38555 | |
| Phone # for sales: | 904-303-4814 |
| Website: | trendzetterz.com |
| E-mail address: | support@trendzetterz.com |
Traders' Resource Links | |
| Trendzetterz has not added any product or service information to TRADERS' RESOURCE. | |
Click here for more information about our publications!
Comments

Request Information From Our Sponsors
- StockCharts.com, Inc.
- Candle Patterns
- Candlestick Charting Explained
- Intermarket Technical Analysis
- John Murphy on Chart Analysis
- John Murphy's Chart Pattern Recognition
- John Murphy's Market Message
- MurphyExplainsMarketAnalysis-Intermarket Analysis
- MurphyExplainsMarketAnalysis-Visual Analysis
- StockCharts.com
- Technical Analysis of the Financial Markets
- The Visual Investor
- VectorVest, Inc.
- Executive Premier Workshop
- One-Day Options Course
- OptionsPro
- Retirement Income Workshop
- Sure-Fire Trading Systems (VectorVest, Inc.)
- Trading as a Business Workshop
- VectorVest 7 EOD
- VectorVest 7 RealTime/IntraDay
- VectorVest AutoTester
- VectorVest Educational Services
- VectorVest OnLine
- VectorVest Options Analyzer
- VectorVest ProGraphics v6.0
- VectorVest ProTrader 7
- VectorVest RealTime Derby Tool
- VectorVest Simulator
- VectorVest Variator
- VectorVest Watchdog