

HOT TOPICS LIST
- MACD
- Fibonacci
- RSI
- Gann
- ADXR
- Stochastics
- Volume
- Triangles
- Futures
- Cycles
- Volatility
- ZIGZAG
- MESA
- Retracement
- Aroon
INDICATORS LIST
LIST OF TOPICS
PRINT THIS ARTICLE
by Koos van der Merwe
When Warren Buffett announces that he has bought a stock, should you buy that stock?
Position: Accumulate
Koos van der Merwe
Has been a technical analyst since 1969, and has worked as a futures and options trader with First Financial Futures in Johannesburg, South Africa.
PRINT THIS ARTICLE
ELLIOTT WAVE
Going With Buffett
02/28/14 05:38:06 PMby Koos van der Merwe
When Warren Buffett announces that he has bought a stock, should you buy that stock?
Position: Accumulate
| On February 27, 2014 Warren Buffett's Berkshire Hathaway announced that it had purchased 1.13 million more shares of DaVita HealthCare Partners. This purchase raises its stake in the kidney dialysis company to 17.7%. With Obamacare becoming a success in the United States of America, more people will be using hospitals, treating illnesses they may have more than ever before. Going for healthcare stocks is obviously the name of the game, but should you buy after an announcement that shares have been bought in a company by a major player? |
|
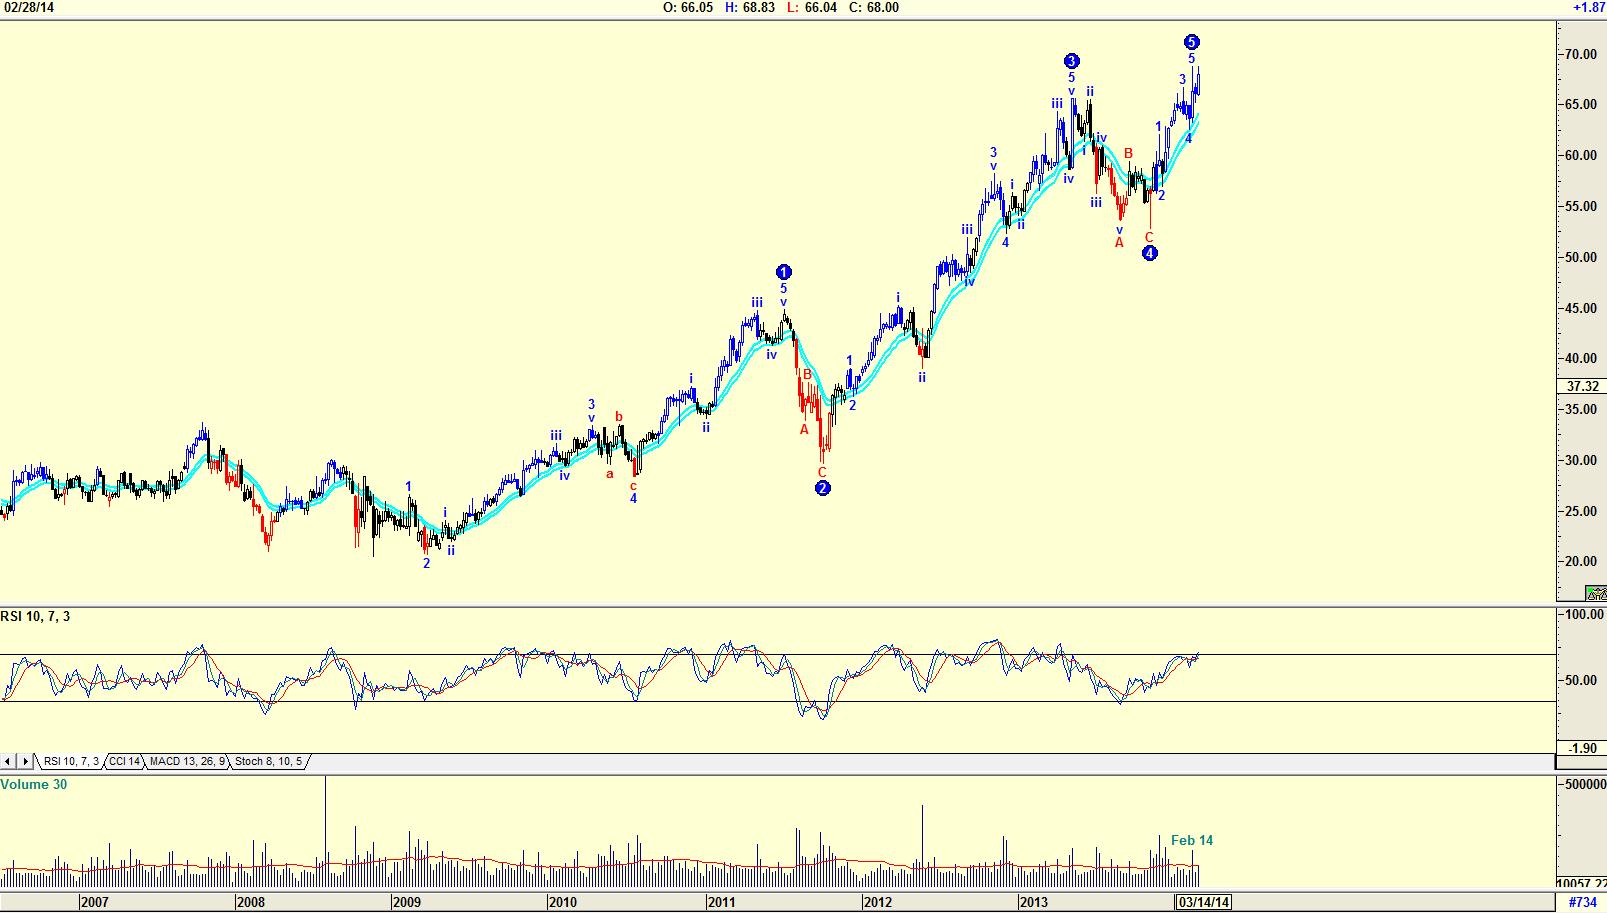
| Figure 1. Weekly chart with Elliott Wave count. |
| Graphic provided by: AdvancedGET. |
| |
| The chart in Figure 1 is a weekly chart with an Elliott Wave count suggesting that the price could be topping out in a WAVE 5. Volume as the price rose over the last few weeks has fallen, with the exception of the week ending February 14, 2014 when volume was high. This could be the week that Berkshire Hathaway made their purchase. |
|
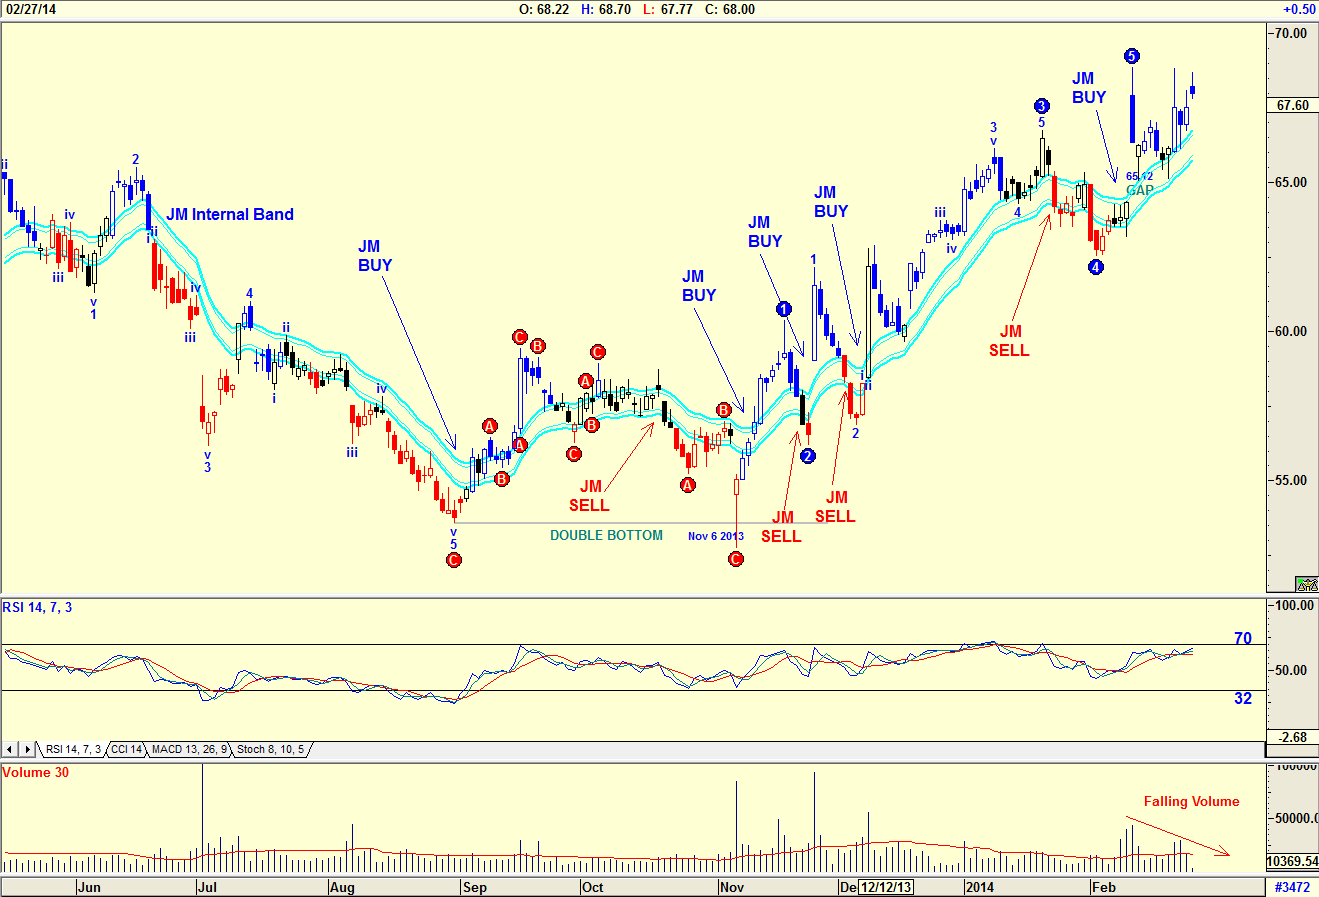
| Figure 2. Daily Chart with Elliott Wave count and JM Internal Band buy/sell signals. |
| Graphic provided by: AdvancedGET. |
| |
| The daily chart also has an Elliott Wave count suggesting a WAVE 5 top. The most recent JM buy happened with a gap, suggesting that the price should now fall to fill the gap. A JM Internal Band is a 15 period simple moving average (SMA) offset by 2% positive and 2% negative. A JM buy occurs when the share price breaks above the upper band and a JM sell occurs when the price breaks below the lower band. Note that the RSI indicator has not yet reached overbought levels, that is, it has not risen above the upper 70 horizontal band and then fallen through it suggesting a sell. Also note the double bottom that formed suggesting a strong buy on November 6, 2013. |
|
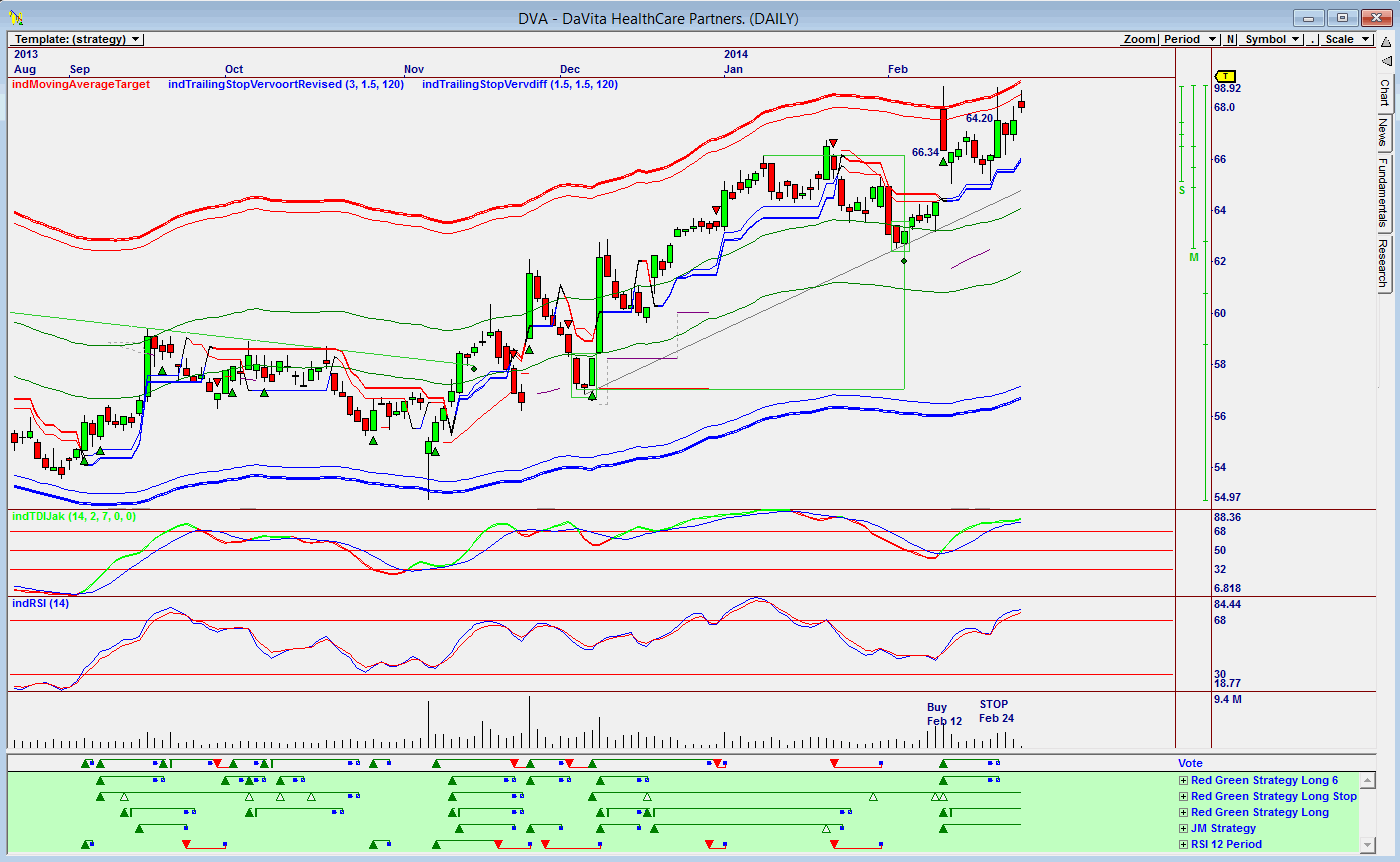
| Figure 3. Omnitrader chart with Vote line suggesting a stop signal. |
| Graphic provided by: Omnitrader. |
| |
| My final chart in Figure 3 is an Omnitrader chart. Note that the Vote line suggested a buy on February 12, 2014 when the price was $66.34, the price on the gap. The buy signal on the vote line is a summation of the strategies shown in green below the vote line. Note that a stop was signaled on February 24, 2014 which means you would have sold on February 25, 2014 as the price fell, and missed the rise in price on February 26 and 27, 2014. The share price is playing with the upper external band, a suggestion of caution. Also note that two indicators, TDIJak and RSI 14 have not given sell signals. Would I be a buyer of DaVita HealthCare Partners at the present price? No, but that Berkshire Hathaway has increased their stake in the company means that I shall watch the share, and buy it on any pullback for a long-term investment. |
Has been a technical analyst since 1969, and has worked as a futures and options trader with First Financial Futures in Johannesburg, South Africa.
| Address: | 3256 West 24th Ave |
| Vancouver, BC | |
| Phone # for sales: | 6042634214 |
| E-mail address: | petroosp@gmail.com |
Click here for more information about our publications!
Comments
Date:�03/07/14Rank:�5Comment:�Hello Mr. Koos van der Merve,
your article was very interesting. I am a Omnitrader user. I have subscribe TASC. Might it be possible that I can get your strategies (3 x Red Green strategy, 1 x JM strategy, RSI 12 period) with template you use in your article in order to reproduce it in my Omnitrader 2014.
Thank you very much in advance
Wolfgang Sitte
Kybergstrasse 39a
82041 Oberhaching
Germany
email: lobowolf1234@hotmail.com

Request Information From Our Sponsors
- StockCharts.com, Inc.
- Candle Patterns
- Candlestick Charting Explained
- Intermarket Technical Analysis
- John Murphy on Chart Analysis
- John Murphy's Chart Pattern Recognition
- John Murphy's Market Message
- MurphyExplainsMarketAnalysis-Intermarket Analysis
- MurphyExplainsMarketAnalysis-Visual Analysis
- StockCharts.com
- Technical Analysis of the Financial Markets
- The Visual Investor
- VectorVest, Inc.
- Executive Premier Workshop
- One-Day Options Course
- OptionsPro
- Retirement Income Workshop
- Sure-Fire Trading Systems (VectorVest, Inc.)
- Trading as a Business Workshop
- VectorVest 7 EOD
- VectorVest 7 RealTime/IntraDay
- VectorVest AutoTester
- VectorVest Educational Services
- VectorVest OnLine
- VectorVest Options Analyzer
- VectorVest ProGraphics v6.0
- VectorVest ProTrader 7
- VectorVest RealTime Derby Tool
- VectorVest Simulator
- VectorVest Variator
- VectorVest Watchdog