

HOT TOPICS LIST
- MACD
- Fibonacci
- RSI
- Gann
- ADXR
- Stochastics
- Volume
- Triangles
- Futures
- Cycles
- Volatility
- ZIGZAG
- MESA
- Retracement
- Aroon
INDICATORS LIST
LIST OF TOPICS
PRINT THIS ARTICLE
by Donald W. Pendergast, Jr.
With a major uptrend in full force, traders and investors patiently wait for a new low-risk buying op in shares of NVIDIA Corp.
Position: N/A
Donald W. Pendergast, Jr.
Freelance financial markets writer and online publisher of the Trendzetterz.com S&P 500 Weekly Forecast service.
PRINT THIS ARTICLE
TREND-CHANNEL
NVDA: Waiting For Pullback In Major Uptrend
02/27/14 05:06:17 PMby Donald W. Pendergast, Jr.
With a major uptrend in full force, traders and investors patiently wait for a new low-risk buying op in shares of NVIDIA Corp.
Position: N/A
| Waiting for a low risk, high reward trading opportunity may be the hardest thing to learn for traders/investors, but the results are usually worth the wait. Here's a look at an especially intriguing long buy set up that may be forming in shares of NVIDIA (NVDA) on its daily chart. |
|
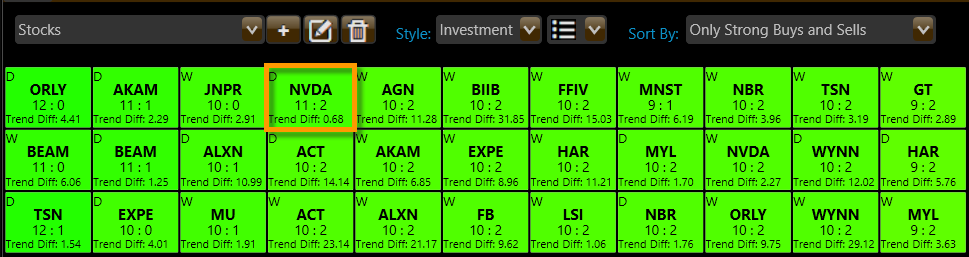
| Figure 1. PhantomTrader scan of strong trend candidates. Notice that the Daily and Weekly time-frames for NVDA are both represented in this scan. |
| Graphic provided by: Phantom Trader by KnowVera Research LLC. |
| |
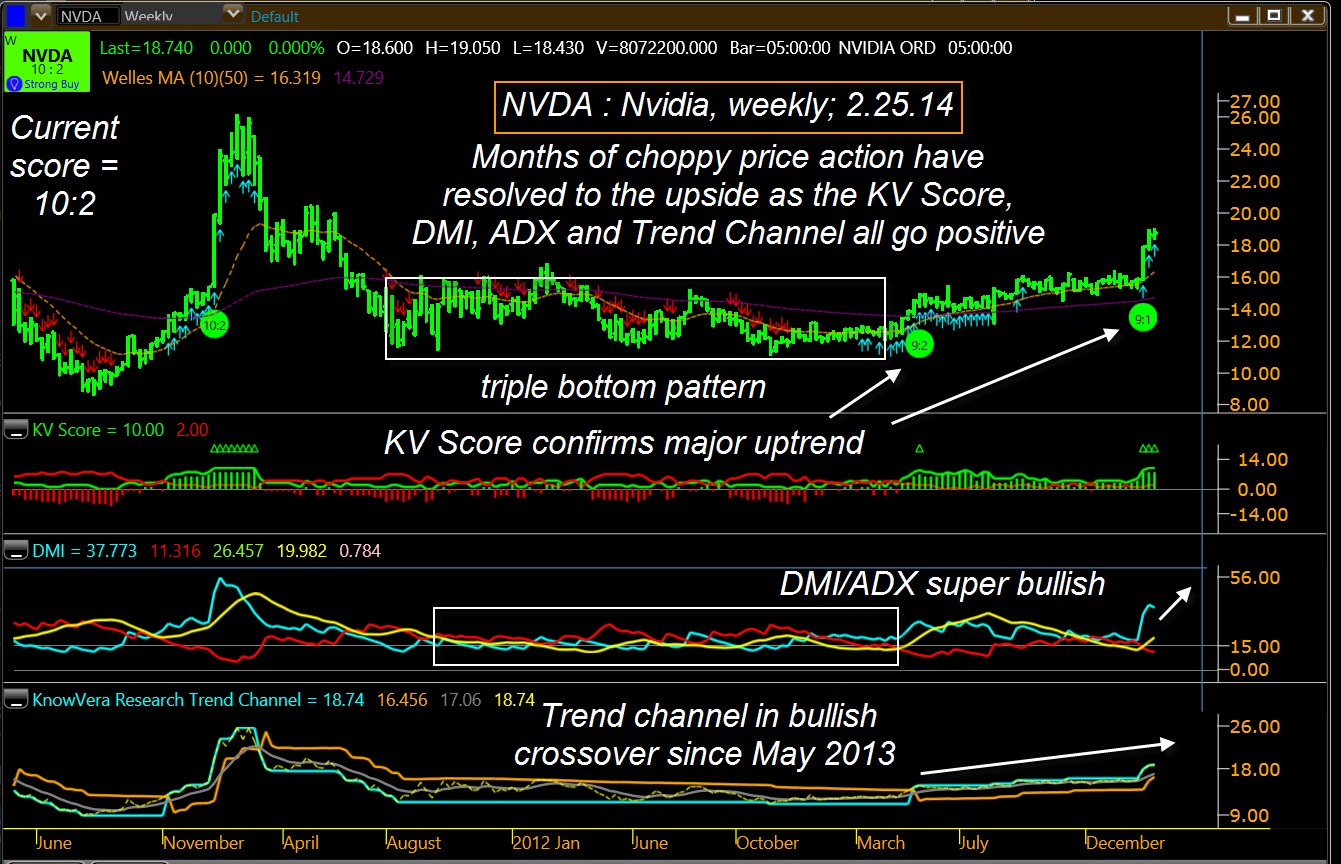
| The weekly chart of NVDA that you see in Figure 2 is a great example of how to identify a major trend reversal — in this case from bearish to bullish. After a massive runup in price between August 2010 and February 2011, NVDA declined rapidly before settling into a wide range consolidation pattern starting in August 2011. This area is highlighted with a white rectangle on the chart and reveals that the range grew smaller as 2012 ended and 2013 began. Of major importance is the confirmed triple bottom pattern contained within the rectangle; note that the third major low also coincided with the launch of the massive, market-wide rally that has been in force since mid-November 2012 and that NVDA has risen by 71% since making that final low then at 11.15 per share. The stock is now trading at 19.05 and may be poised for even more gains after a minor pullback toward key support on its daily time frame. But right now, let's simply detail the procedure needed to locate this stock and how to identify some of the key trend following indicators on its weekly chart. The Trend Monitor in Phantom Trader offers a wide range of scanning windows to find strong/weak stocks and by focusing on the 'only strong buys and sells' screen on the 'investment' (daily/weekly) time frame we come up with this list of all-green, high trend score stocks - like NVDA. Clicking on the NVDA cell immediately brings up a daily/weekly chart combo for the stock. 1. The triple bottom pattern after a big decline was the first clue that a bullish reversal was likely. 2. The appearance of the little blue arrows under the weekly price bars on March 16, 2012 confirmed the ADX (Average Directional Movement index) was rising. 3. On April 27, 2012 the KV Score indicator went positive (histogram turning green again). 4. On May 18, 2012 the trend channel (bottom of chart) experienced a bullish crossover. 5. Also on May 18, 2012 the big green dot with a Trend Score of 9:2 appeared on the chart. At that point, traders/investors had full confirmation that a strong bullish trend was gaining powerful momentum on the weekly time frame; pure trend followers who were convinced of continued good earnings for the stock could have simply gone long then (May 18, 2012) and let the trade run, using the lower gold trend channel line as there trailing stop for the life of the trade, which is still an open trade by the way. More skillful (and patient) active traders might have wanted to wait for a suitable pullback on the daily chart for a lower risk, higher reward entry point once the major weekly chart crossover was a done deal; there have been several such opportunities to do so since June 2012, although in the long run the trend followers would have had a much simpler trading experience by simply buying once and then holding on, letting the trend channel alert them when to finally sell out. Notice that the trend strengthened noticeable at several junctures since the channel crossover — these are depicted by the small green triangles above the KV Score histogram. Sometimes these occur just before major reversal points (at the zone of maximum trend strength) and at times can also appear week after week as a monster trend continues to rise/fall. We see three consecutive green triangles already and that implies that there is a tremendous amount of "smart money" buying pressure forcing this stock higher now. |
|
| Figure 2. NVIDIA's (NVDA) weekly chart features a strongly bullish trend. |
| Graphic provided by: Phantom Trader by KnowVera Research LLC. |
| |
| However, even the smart money knows when it's time to back off the throttle and wait for a pullback to buy more shares at a better price and that's likely what's happening now on the daily chart for NVDA (not shown); this daily chart is also super-bullish as is its weekly counterpart; however, its stochastic is already turning down from an extremely overbought level and this implies that some short term profit taking/distribution is underway. If/when NVDA pulls in toward its 10-bar moving average on the daily chart and the stochastic bottoms and begins to turn higher again, that would constitute a low risk, high probability long trade entry. The next major resistance area for the stock doesn't occur until the 20.05 to 20.43 area and that allows the stock 2.00 to 2.50 points to run higher before another wave of profit taking is likely. The .SPX (S&P 500 index) is also near record highs (and may try to break higher yet again) so NVDA may have plenty of help if it decides to charge even higher after some rest. Remember to keep your trade risks small and to trade wisely until we meet again. |
Freelance financial markets writer and online publisher of the Trendzetterz.com S&P 500 Weekly Forecast service.
| Title: | Market consultant and writer |
| Company: | Trendzetterz |
| Address: | 81 Hickory Hollow Drive |
| Crossville, TN 38555 | |
| Phone # for sales: | 904-303-4814 |
| Website: | trendzetterz.com |
| E-mail address: | support@trendzetterz.com |
Traders' Resource Links | |
| Trendzetterz has not added any product or service information to TRADERS' RESOURCE. | |
Click here for more information about our publications!
PRINT THIS ARTICLE

Request Information From Our Sponsors
- StockCharts.com, Inc.
- Candle Patterns
- Candlestick Charting Explained
- Intermarket Technical Analysis
- John Murphy on Chart Analysis
- John Murphy's Chart Pattern Recognition
- John Murphy's Market Message
- MurphyExplainsMarketAnalysis-Intermarket Analysis
- MurphyExplainsMarketAnalysis-Visual Analysis
- StockCharts.com
- Technical Analysis of the Financial Markets
- The Visual Investor
- VectorVest, Inc.
- Executive Premier Workshop
- One-Day Options Course
- OptionsPro
- Retirement Income Workshop
- Sure-Fire Trading Systems (VectorVest, Inc.)
- Trading as a Business Workshop
- VectorVest 7 EOD
- VectorVest 7 RealTime/IntraDay
- VectorVest AutoTester
- VectorVest Educational Services
- VectorVest OnLine
- VectorVest Options Analyzer
- VectorVest ProGraphics v6.0
- VectorVest ProTrader 7
- VectorVest RealTime Derby Tool
- VectorVest Simulator
- VectorVest Variator
- VectorVest Watchdog