HOT TOPICS LIST
- MACD
- Fibonacci
- RSI
- Gann
- ADXR
- Stochastics
- Volume
- Triangles
- Futures
- Cycles
- Volatility
- ZIGZAG
- MESA
- Retracement
- Aroon
INDICATORS LIST
LIST OF TOPICS
PRINT THIS ARTICLE
by Matt Blackman
Since peaking above $48 in April 2011, silver and other precious metals have been in correction mode. After hitting bottom for the second time in January, is now the time to buy 'poor-man's gold'?
Position: N/A
Matt Blackman
Matt Blackman is a full-time technical and financial writer and trader. He produces corporate and financial newsletters, and assists clients in getting published in the mainstream media. He is the host of TradeSystemGuru.com. Matt has earned the Chartered Market Technician (CMT) designation. Find out what stocks and futures Matt is watching on Twitter at www.twitter.com/RatioTrade
PRINT THIS ARTICLE
SEASONAL TRADING
Is It Time To Buy Silver?
02/27/14 04:38:52 PMby Matt Blackman
Since peaking above $48 in April 2011, silver and other precious metals have been in correction mode. After hitting bottom for the second time in January, is now the time to buy 'poor-man's gold'?
Position: N/A
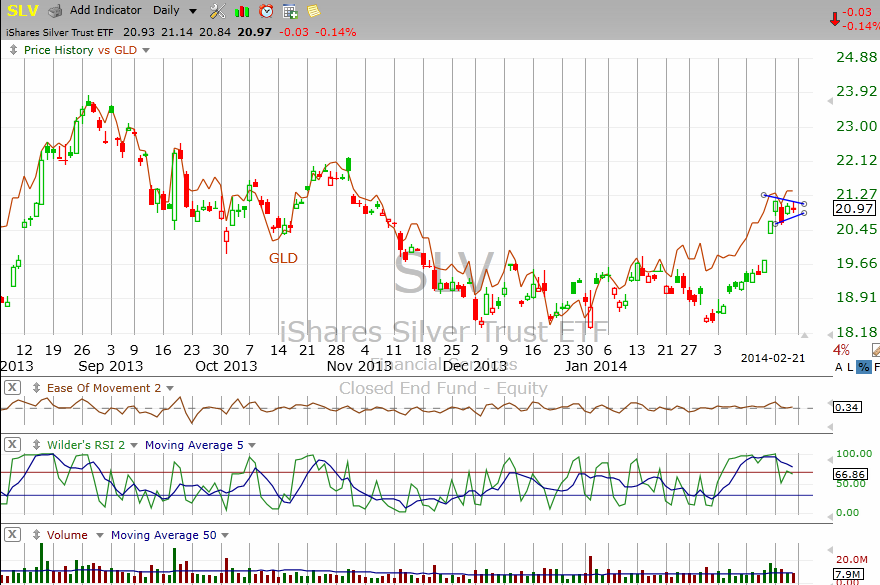
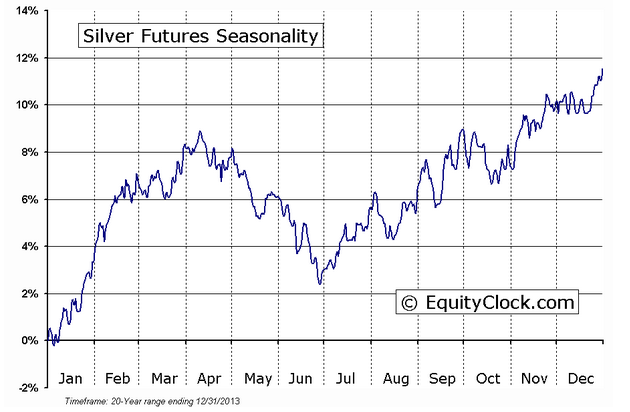
| In 2011, first silver in April, then gold in October hit their highest prices ever recorded. But then both began to drop over the next two years, with silver losing more than half its value before bottoming in January 2014. According to the seasonal chart in Figure 2, January has historically been a strong month after which silver has rallied powerfully into the second quarter. |

|
| Figure 1 – Daily chart of the iShares Silver Trust ETF (SLV) showing the recent double bottom and rally with the bullish pennant chart pattern to February 22, 2014. |
| Graphic provided by: TC2000.com. |
| |
| There has been an interesting correlation between SLV and the S&P500 since 2009. SLV bottomed well ahead of stocks in October 2008 and rallied strongly to April 2011 before rolling over about the same time as stocks. But when stocks began to rally again in September 2011, precious metals kept dropping due in large part to falling inflationary pressure. |

|
| Figure 2 – Seasonal chart of silver showing historic periods of strength and weakness. |
| Graphic provided by: EquityClock.com. |
| |
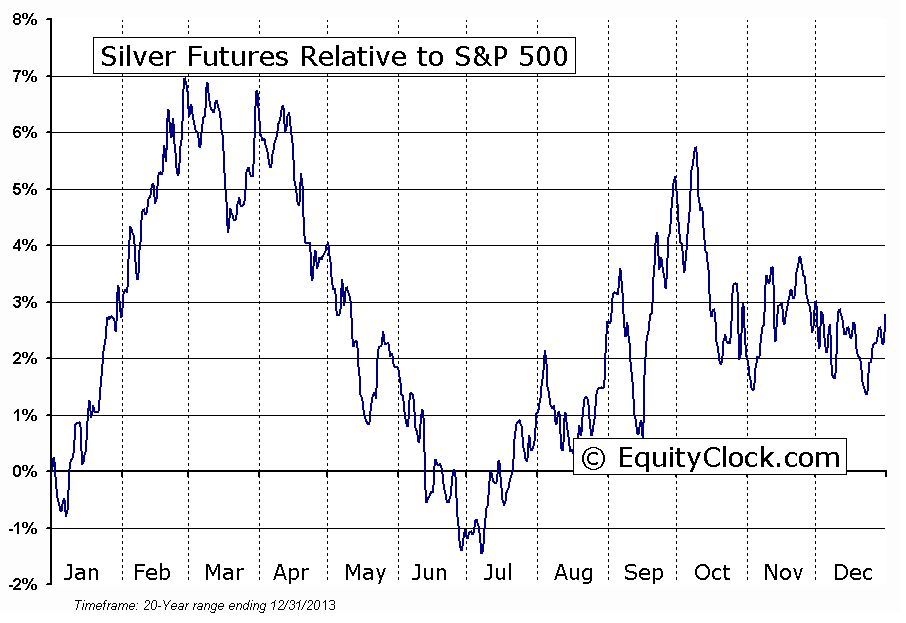
| Figure 2 shows periods of seasonal strength in silver when the metal has been strong — first from January into April and then again from late June through year-end. Figure 3, which shows the relative strength of silver to the S&P 500, demonstrates that silver has historically outperformed stocks until the end of February after which stocks have been a better bet until July. Silver has then outperformed stocks until the first week of October. |
| So is it time to buy silver? The answer depends on whether you are a pure commodity trader or also trade stocks. Seasonal commodity traders should expect silver to rally into the first week of April while seasonal stock traders should begin exiting silver positions in favor of outperforming stocks at the end of February. Seasonal charts need to be put into context with recent performance. Silver (and gold) have experienced weakness over the last two years and will be responsive to growing inflationary pressure as the economy recovers. The bullish pennant chart pattern often provides a good opportunity to buy. When combined with seasonal factors, there is a good chance that silver will continue to rise into early April. After that, the period from July through December has been strong. |

|
| Figure 3 – Relative strength seasonal chart showing how silver has performed relative to stocks over the last 20 years. |
| Graphic provided by: EquityClock.com. |
| |
| The next question to examine is when owning silver is preferable to owning silver miners and vice-versa, which I will be discussing in an upcoming article. |
Matt Blackman is a full-time technical and financial writer and trader. He produces corporate and financial newsletters, and assists clients in getting published in the mainstream media. He is the host of TradeSystemGuru.com. Matt has earned the Chartered Market Technician (CMT) designation. Find out what stocks and futures Matt is watching on Twitter at www.twitter.com/RatioTrade
| Company: | TradeSystemGuru.com |
| Address: | Box 2589 |
| Garibaldi Highlands, BC Canada | |
| Phone # for sales: | 604-898-9069 |
| Fax: | 604-898-9069 |
| Website: | www.tradesystemguru.com |
| E-mail address: | indextradermb@gmail.com |
Traders' Resource Links | |
| TradeSystemGuru.com has not added any product or service information to TRADERS' RESOURCE. | |
Click here for more information about our publications!
PRINT THIS ARTICLE

Request Information From Our Sponsors
- StockCharts.com, Inc.
- Candle Patterns
- Candlestick Charting Explained
- Intermarket Technical Analysis
- John Murphy on Chart Analysis
- John Murphy's Chart Pattern Recognition
- John Murphy's Market Message
- MurphyExplainsMarketAnalysis-Intermarket Analysis
- MurphyExplainsMarketAnalysis-Visual Analysis
- StockCharts.com
- Technical Analysis of the Financial Markets
- The Visual Investor
- VectorVest, Inc.
- Executive Premier Workshop
- One-Day Options Course
- OptionsPro
- Retirement Income Workshop
- Sure-Fire Trading Systems (VectorVest, Inc.)
- Trading as a Business Workshop
- VectorVest 7 EOD
- VectorVest 7 RealTime/IntraDay
- VectorVest AutoTester
- VectorVest Educational Services
- VectorVest OnLine
- VectorVest Options Analyzer
- VectorVest ProGraphics v6.0
- VectorVest ProTrader 7
- VectorVest RealTime Derby Tool
- VectorVest Simulator
- VectorVest Variator
- VectorVest Watchdog
