HOT TOPICS LIST
- MACD
- Fibonacci
- RSI
- Gann
- ADXR
- Stochastics
- Volume
- Triangles
- Futures
- Cycles
- Volatility
- ZIGZAG
- MESA
- Retracement
- Aroon
INDICATORS LIST
LIST OF TOPICS
PRINT THIS ARTICLE
by Koos van der Merwe
Altria Group pushed the tobacco industry higher last week making it today's featured tobacco winner.
Position: Buy
Koos van der Merwe
Has been a technical analyst since 1969, and has worked as a futures and options trader with First Financial Futures in Johannesburg, South Africa.
PRINT THIS ARTICLE
RSI
A Look At Altria
02/27/14 11:55:55 AMby Koos van der Merwe
Altria Group pushed the tobacco industry higher last week making it today's featured tobacco winner.
Position: Buy
| We all know that cigarette smoking is bad for overall health, so what is pushing Altria Group (MO) to new highs? Technical analysts don't ask such questions. They just look at the charts and decide if the share worth a buy or not. Does that chart pattern that has formed tell us that it is a share you should add to a portfolio. Of course, when the share offers a good dividend, then in a market where bears are calling for a crash greater than the 1929 crash, (they don't say exactly when it will occur but will be quick to shout from the roof tops, "see, we were right" even if the crash occurs in three years time,) investing in a good dividend paying stock in times of uncertainty is an advantage. |

|
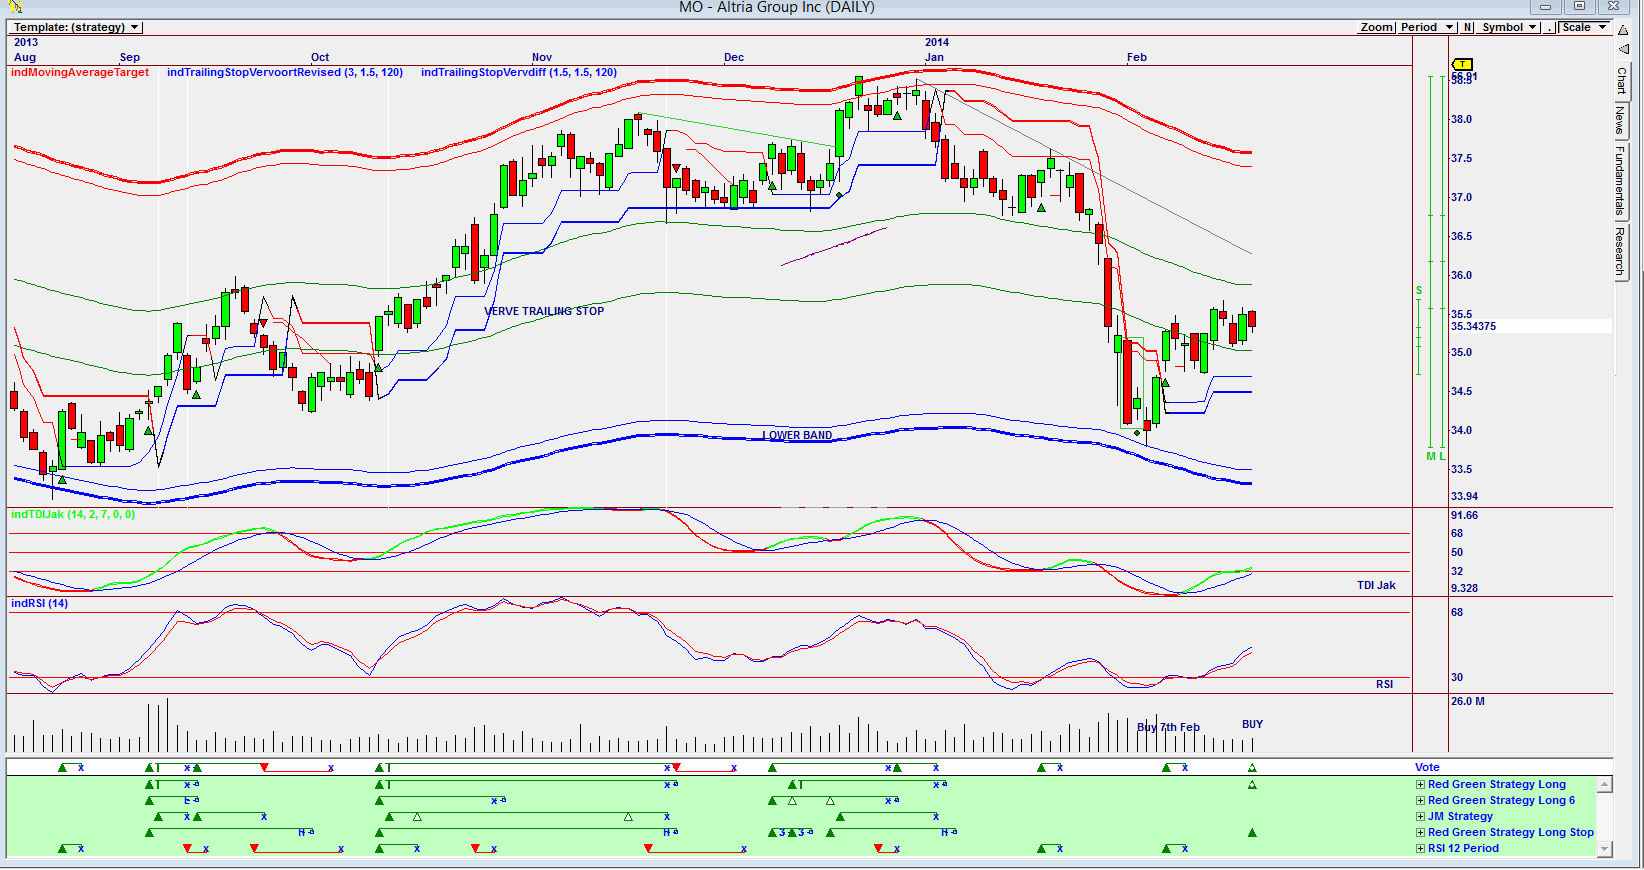
| Figure 1. An Omnitrader chart showing a buy signal. |
| Graphic provided by: Omnitrader. |
| |
| The chart in Figure 1, and Omnitrader daily chart of MO shows that a new buy signal was given on the Vote line, a summation of the strategies shown in green below the Vote line. Note the price has bounced off the lower external band and has now given a new buy after a buy was given on February 7, 2014 and stopped out four days later. Is this suggesting that the share price is consolidating prior to a strong move up? Low volume as the price moves sideways is suggesting uncertainty as to market direction. However, the TDI Jak indicator and the RSI 14-period indicator are both positive suggesting a move up. |

|
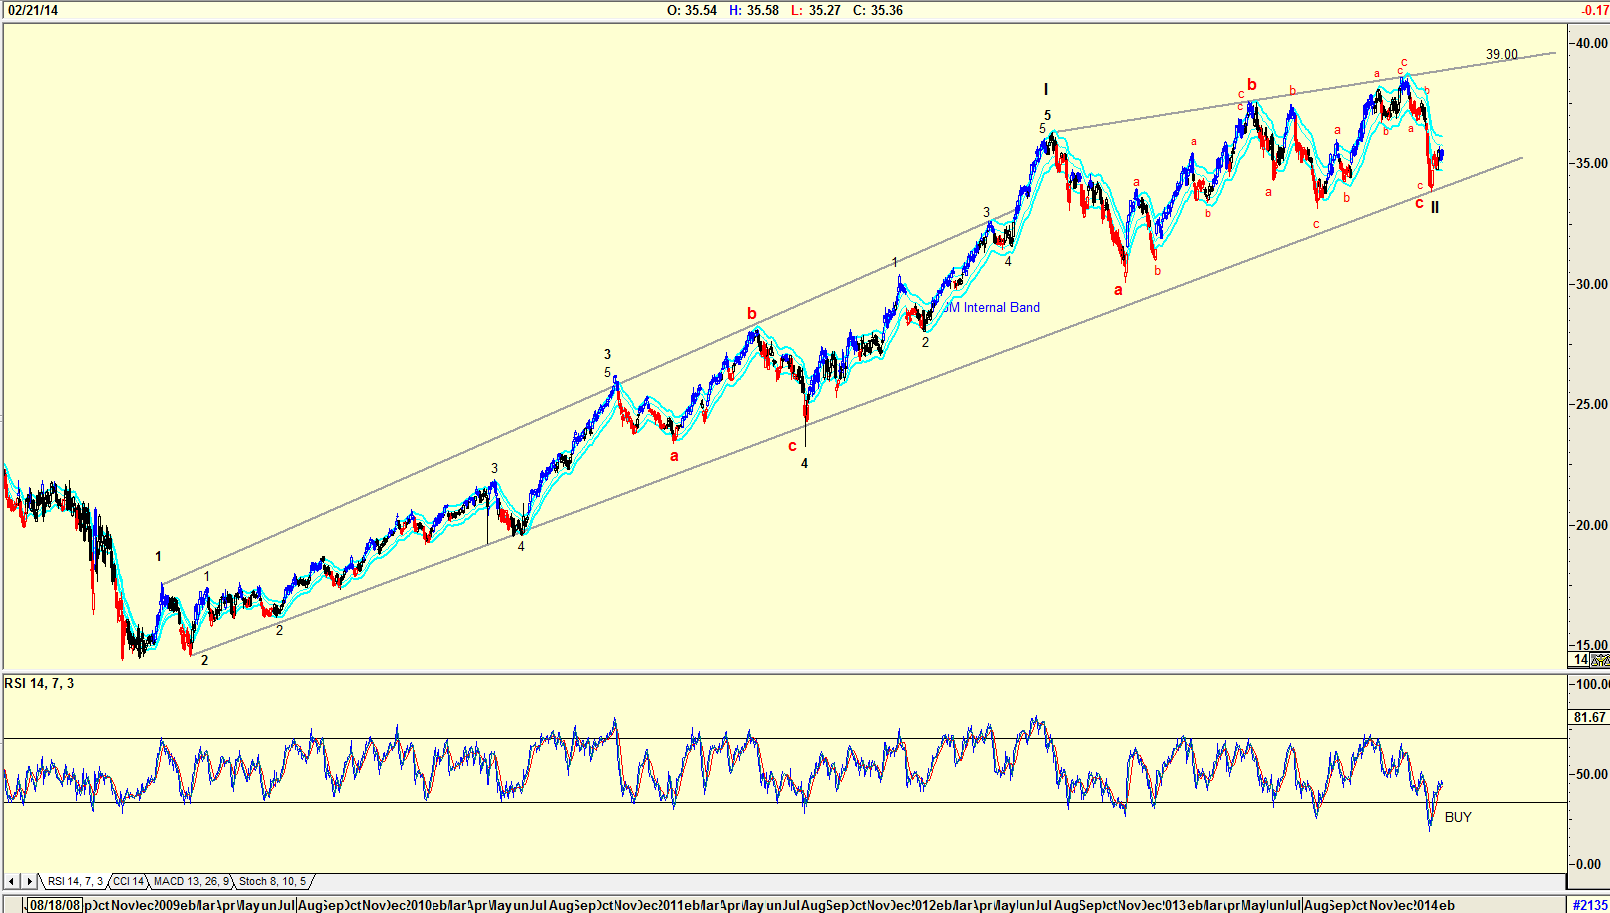
| Figure 2. A Daily chart with resistance line suggesting a target. |
| Graphic provided by: AdvancedGET. |
| |
| The chart in Figure 2 is a daily chart with an Elliott Wave count that could be open to correction. You should never forget, however, that an Elliott Wave count is merely a signpost in the wilderness and can change direction and count at the next signpost a little way down the road. However, looking at the chart, the RSI indicator is suggesting a buy. The upper resistance line is suggesting a target of around $39, an approximately 10% increase in price. Conservative investors could wait until the price breaks above the upper JM Internal Band indicator. A JM Internal Band indicator is a 15-period simple moving average offset 2% positive and 2% negative. I would be a buyer of Altria at present levels, but I would keep my stops close. |
Has been a technical analyst since 1969, and has worked as a futures and options trader with First Financial Futures in Johannesburg, South Africa.
| Address: | 3256 West 24th Ave |
| Vancouver, BC | |
| Phone # for sales: | 6042634214 |
| E-mail address: | petroosp@gmail.com |
Click here for more information about our publications!
PRINT THIS ARTICLE

|

Request Information From Our Sponsors
- StockCharts.com, Inc.
- Candle Patterns
- Candlestick Charting Explained
- Intermarket Technical Analysis
- John Murphy on Chart Analysis
- John Murphy's Chart Pattern Recognition
- John Murphy's Market Message
- MurphyExplainsMarketAnalysis-Intermarket Analysis
- MurphyExplainsMarketAnalysis-Visual Analysis
- StockCharts.com
- Technical Analysis of the Financial Markets
- The Visual Investor
- VectorVest, Inc.
- Executive Premier Workshop
- One-Day Options Course
- OptionsPro
- Retirement Income Workshop
- Sure-Fire Trading Systems (VectorVest, Inc.)
- Trading as a Business Workshop
- VectorVest 7 EOD
- VectorVest 7 RealTime/IntraDay
- VectorVest AutoTester
- VectorVest Educational Services
- VectorVest OnLine
- VectorVest Options Analyzer
- VectorVest ProGraphics v6.0
- VectorVest ProTrader 7
- VectorVest RealTime Derby Tool
- VectorVest Simulator
- VectorVest Variator
- VectorVest Watchdog
