HOT TOPICS LIST
- MACD
- Fibonacci
- RSI
- Gann
- ADXR
- Stochastics
- Volume
- Triangles
- Futures
- Cycles
- Volatility
- ZIGZAG
- MESA
- Retracement
- Aroon
INDICATORS LIST
LIST OF TOPICS
PRINT THIS ARTICLE
by Donald W. Pendergast, Jr.
With steadily declining long-term money flow, will shares of Harman International have what it takes to mount a new rally?
Position: N/A
Donald W. Pendergast, Jr.
Freelance financial markets writer and online publisher of the Trendzetterz.com S&P 500 Weekly Forecast service.
PRINT THIS ARTICLE
KELTNER CHANNELS
HAR: Fourth Time A Charm?
02/27/14 11:57:01 AMby Donald W. Pendergast, Jr.
With steadily declining long-term money flow, will shares of Harman International have what it takes to mount a new rally?
Position: N/A
| The progressive rise in the share price of Harman International (HAR) since late April 2013 has been simply breathtaking; up by 150% in less than ten months, the stock is still in a technical uptrend on its daily, weekly, and monthly charts and has been one of the best performers in the entire S&P 500 index (.SPX) over the past year. The uptrend is getting a bit strained on its daily time frame, however, and may be warning of a proportional correction heading into March 2014. Here's a closer look. |

|
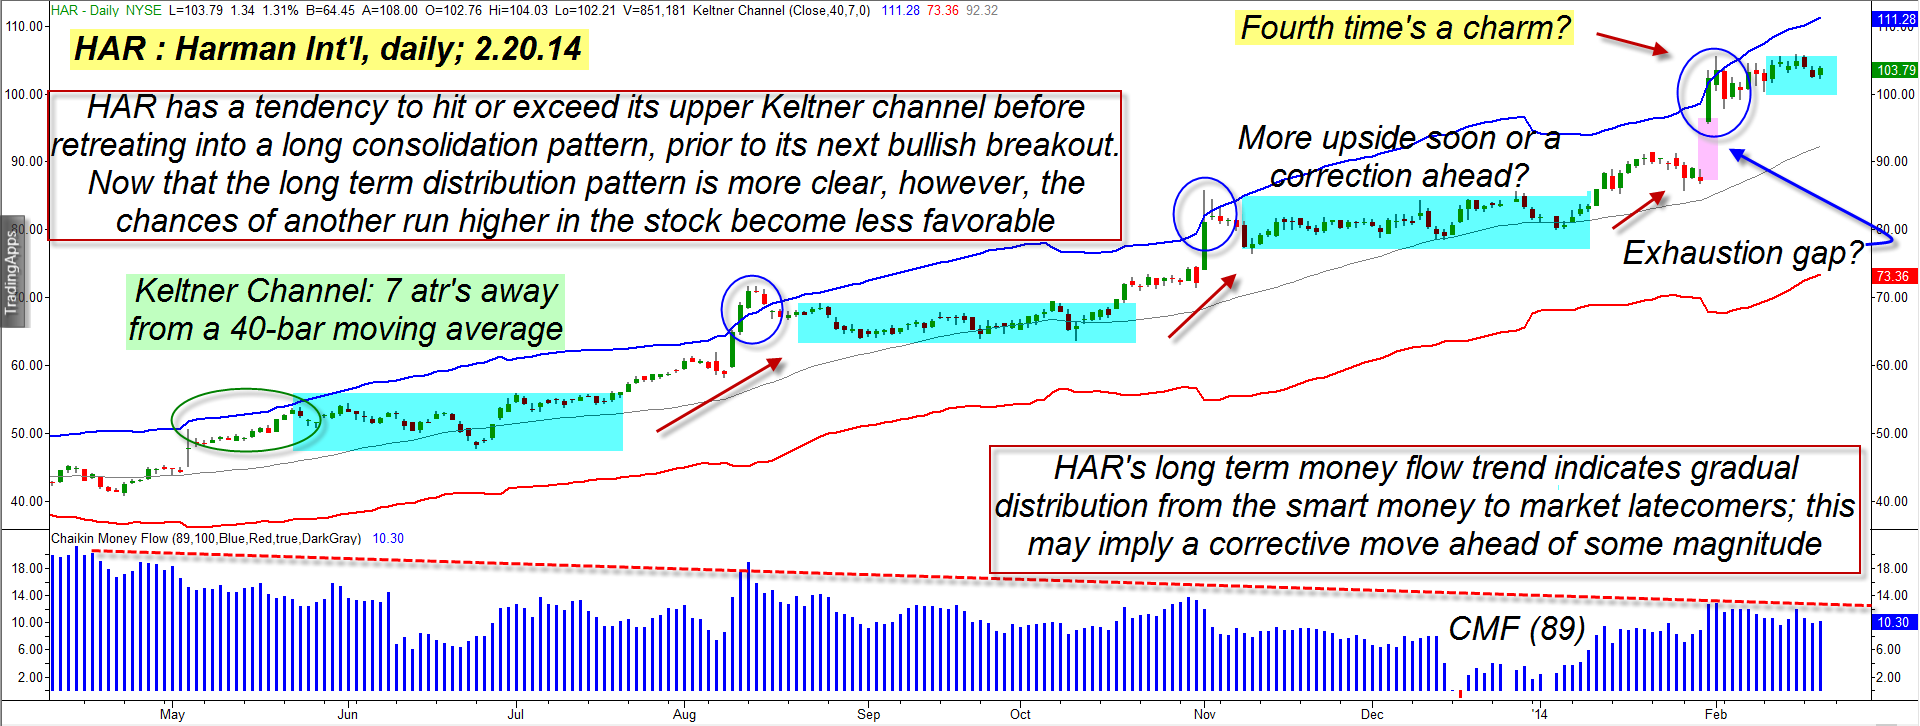
| Figure 1. Harman Intternational (HAR) has been remarkably consistent with its pattern of spike/pullback/consolidation/spike price action since May 2013. Waning long-term money flow is confirming steady distribution by the smart money, though, and that makes odds of another repeat less likely now. |
| Graphic provided by: TradeStation. |
| |
| The daily chart of HAR in Figure 1 reveals much of the nature of its trading pattern and the market psychology that drives such patterns. On no less than four occasions during 2013-2014, HAR has thrust higher to either hit and/or exceed its upper Keltner channel (set at seven average true ranges (ATR) away from a 40-bar moving average) before pulling back inside the band to start a period of sideways, range bound price action (a consolidation). After a sustained consolidation, the stock would then leap higher once again, striking or even piercing the upper Keltner band, repeating the process four times in a row now since May 2013. While this latest hit of the upper band has also seen a subsequent pullback, along with the start of a new consolidation, the odds of yet another bullish breakout toward the top band become less likely with every passing day, and here's why: 1. The long-term money flow histogram (CMF)(89) keeps trending lower with each new touch of the upper band, and this tells us that the "smart money" was using each new rally to sell more of their long-term positions into the hands of less experienced market latecomers (the "dumb money"). Since it's always the smart money that has the cash buying power to drive all liquid markets higher (they account for about 80% of all trading activity in the US markets, for example), anytime you see the money flow histogram peaks declining on a rally, you know that at some point a correction will occur, as the dumb money simply does not have the financial power to drive markets higher for any length of time all on their own. 2. HAR is exhibiting similar "collisions" with its weekly chart upper Keltner channel, too. The weekly chart shows strong chart resistance between 108.00 and 116.00. It is possible that after a proportional correction on the daily chart HAR can mount one final rally into that heavy resistance range; if you see the final high occurs inside the upper band on the weekly chart, you will have an excellent opportunity to see a bearish trend reversal on the weekly chart too, which should be more substantial and long lasting. |

|
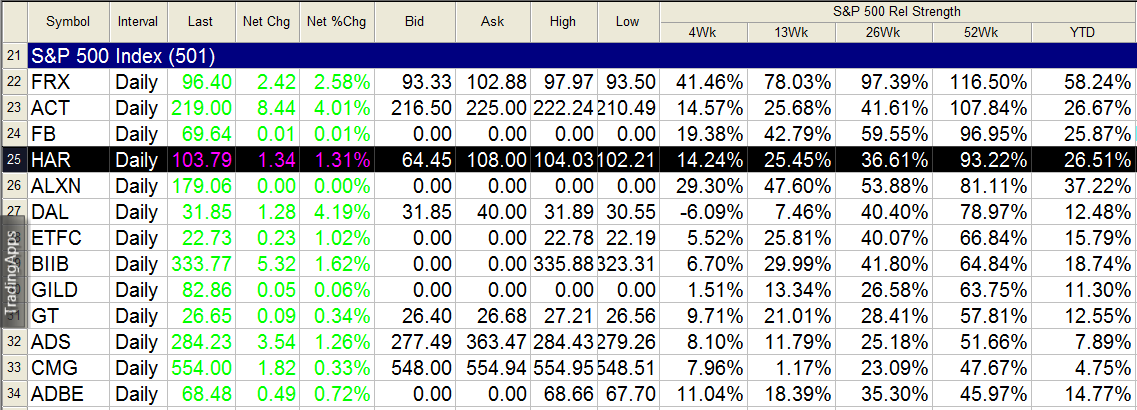
| Figure 2. HAR has been wildly outperforming the .SPX (S&P 500 index) over the past 52 weeks and on shorter time periods as well. |
| Graphic provided by: TradeStation. |
| Graphic provided by: TradeStation RadarScreen. |
| |
| Given the steady distribution pattern on the daily chart, going long here in HAR would appear to be a low probability trade for swing traders, although near-term covered call (CC) traders may still want to consider a long entry in hopes HAR will make it up toward the $110-plus area sooner rather than later. Using in-the-money (ITM) options like the March '14 HAR $100 call will provide more staying power than the out-of-the-money (OTM) ones and this could be a good choice for those who are confident that HAR can pull off yet another consolidation/rally trick soon. Existing longs in HAR should be running a fairly close trailing stop and if you see the stock drop beneath the latest blue range box, just sell out and wait for another trade opportunity. Trade wisely until we meet here again. |
Freelance financial markets writer and online publisher of the Trendzetterz.com S&P 500 Weekly Forecast service.
| Title: | Market consultant and writer |
| Company: | Trendzetterz |
| Address: | 81 Hickory Hollow Drive |
| Crossville, TN 38555 | |
| Phone # for sales: | 904-303-4814 |
| Website: | trendzetterz.com |
| E-mail address: | support@trendzetterz.com |
Traders' Resource Links | |
| Trendzetterz has not added any product or service information to TRADERS' RESOURCE. | |
Click here for more information about our publications!
Comments

Request Information From Our Sponsors
- StockCharts.com, Inc.
- Candle Patterns
- Candlestick Charting Explained
- Intermarket Technical Analysis
- John Murphy on Chart Analysis
- John Murphy's Chart Pattern Recognition
- John Murphy's Market Message
- MurphyExplainsMarketAnalysis-Intermarket Analysis
- MurphyExplainsMarketAnalysis-Visual Analysis
- StockCharts.com
- Technical Analysis of the Financial Markets
- The Visual Investor
- VectorVest, Inc.
- Executive Premier Workshop
- One-Day Options Course
- OptionsPro
- Retirement Income Workshop
- Sure-Fire Trading Systems (VectorVest, Inc.)
- Trading as a Business Workshop
- VectorVest 7 EOD
- VectorVest 7 RealTime/IntraDay
- VectorVest AutoTester
- VectorVest Educational Services
- VectorVest OnLine
- VectorVest Options Analyzer
- VectorVest ProGraphics v6.0
- VectorVest ProTrader 7
- VectorVest RealTime Derby Tool
- VectorVest Simulator
- VectorVest Variator
- VectorVest Watchdog
