

HOT TOPICS LIST
- MACD
- Fibonacci
- RSI
- Gann
- ADXR
- Stochastics
- Volume
- Triangles
- Futures
- Cycles
- Volatility
- ZIGZAG
- MESA
- Retracement
- Aroon
INDICATORS LIST
LIST OF TOPICS
PRINT THIS ARTICLE
by Matt Blackman
January wasn't a great month for US stocks but this resource company has strongly outperformed since the beginning of 2014. In this article we examine what's behind this strength.
Position: N/A
Matt Blackman
Matt Blackman is a full-time technical and financial writer and trader. He produces corporate and financial newsletters, and assists clients in getting published in the mainstream media. He is the host of TradeSystemGuru.com. Matt has earned the Chartered Market Technician (CMT) designation. Find out what stocks and futures Matt is watching on Twitter at www.twitter.com/RatioTrade
PRINT THIS ARTICLE
TRIANGLES
What's Up With Canadian Natural Resources?
02/25/14 04:12:48 PMby Matt Blackman
January wasn't a great month for US stocks but this resource company has strongly outperformed since the beginning of 2014. In this article we examine what's behind this strength.
Position: N/A
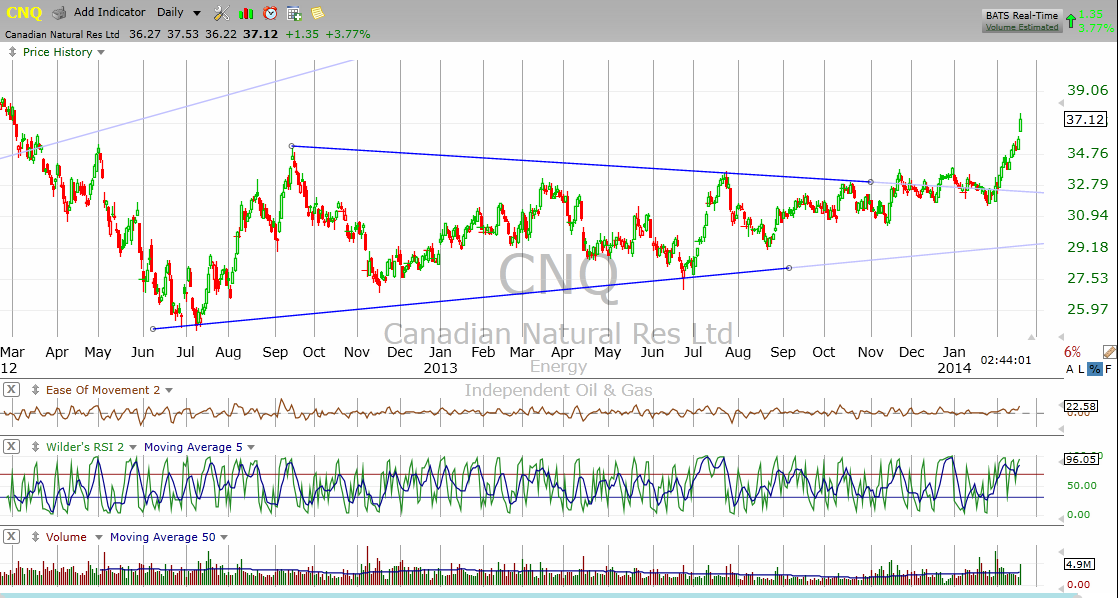
| As major indexes pierced trendline support in January 2014, the same wasn't the case for Canadian Natural Resources (CNQ:NYSE and CNQ.TO:TSE). By February 19, 2014 the stock had gained more than 10% YTD. And much of the strength by Canada's second largest natural gas producer has been due to very cold temperatures along the East Coast prompting higher heating demand. Investor optimism for the stock was further fueled by the recent purchase of Devon Energy announced February 19, 2014. |
|
| Figure 1 � Daily chart of Canadian Natural Resources Ltd. (CNQ) showing the large triangle with decisive breakout in early February 2014. |
| Graphic provided by: TC2000.com. |
| |
| Natural gas prices popped above $6 per million British Thermal Units (BTUs) on February 19, 2014 which was a five-year high for the commodity. The rise of more than 40% this year for the gas has been driven by waves of arctic outflow winds that have caused unseasonably low temperatures in eastern Canada and the US. Fundamentally, CNQ has seen revenue rise 4.4% in the last four quarters and earnings per share surged more than 220% in the latest quarter to $1.07 on sales of $17.7 billion according to data from TC2000.com. As the daily chart in Figure 1 shows, CNQ recently broke out of a triangle pattern that had been forming since mid-2012. |
|
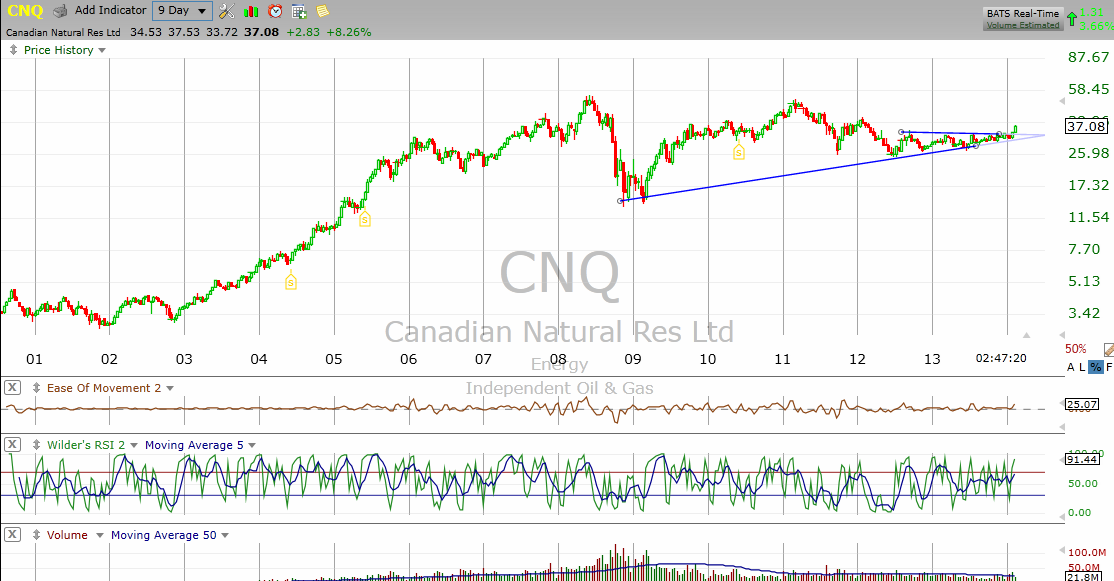
| Figure 2 � Nine day chart back to the year 2000 of Canadian Natural Resources Ltd. (CNQ) showing the trend support line from the 2009 low. |
| Graphic provided by: TC2000.com. |
| |
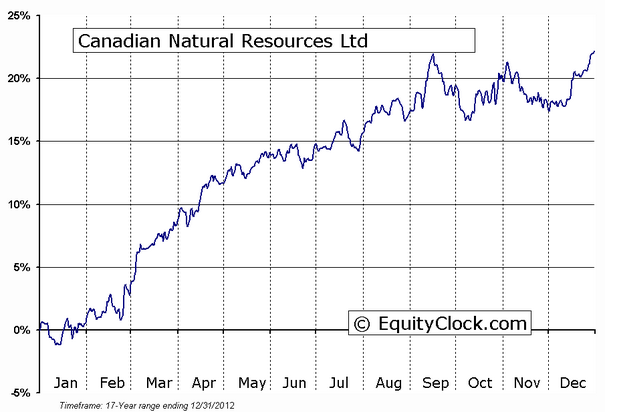
| From a seasonal perspective, the period from late February into September has typically been strong for CNQ with the stock rising more than 15% on average over the period. |
|
| Figure 3 � Chart of Canadian Natural Resources (TSX) showing periods of the strongest times for the stock over the 17 years ending December 31, 2012. |
| Graphic provided by: www.EquityClock.com. |
| |
| So the combination of technical and fundamental factors is responsible for CNQ's recent strength which will be further supported by seasonal demand into the third quarter. |
Matt Blackman is a full-time technical and financial writer and trader. He produces corporate and financial newsletters, and assists clients in getting published in the mainstream media. He is the host of TradeSystemGuru.com. Matt has earned the Chartered Market Technician (CMT) designation. Find out what stocks and futures Matt is watching on Twitter at www.twitter.com/RatioTrade
| Company: | TradeSystemGuru.com |
| Address: | Box 2589 |
| Garibaldi Highlands, BC Canada | |
| Phone # for sales: | 604-898-9069 |
| Fax: | 604-898-9069 |
| Website: | www.tradesystemguru.com |
| E-mail address: | indextradermb@gmail.com |
Traders' Resource Links | |
| TradeSystemGuru.com has not added any product or service information to TRADERS' RESOURCE. | |
Click here for more information about our publications!
PRINT THIS ARTICLE

Request Information From Our Sponsors
- StockCharts.com, Inc.
- Candle Patterns
- Candlestick Charting Explained
- Intermarket Technical Analysis
- John Murphy on Chart Analysis
- John Murphy's Chart Pattern Recognition
- John Murphy's Market Message
- MurphyExplainsMarketAnalysis-Intermarket Analysis
- MurphyExplainsMarketAnalysis-Visual Analysis
- StockCharts.com
- Technical Analysis of the Financial Markets
- The Visual Investor
- VectorVest, Inc.
- Executive Premier Workshop
- One-Day Options Course
- OptionsPro
- Retirement Income Workshop
- Sure-Fire Trading Systems (VectorVest, Inc.)
- Trading as a Business Workshop
- VectorVest 7 EOD
- VectorVest 7 RealTime/IntraDay
- VectorVest AutoTester
- VectorVest Educational Services
- VectorVest OnLine
- VectorVest Options Analyzer
- VectorVest ProGraphics v6.0
- VectorVest ProTrader 7
- VectorVest RealTime Derby Tool
- VectorVest Simulator
- VectorVest Variator
- VectorVest Watchdog