

HOT TOPICS LIST
- MACD
- Fibonacci
- RSI
- Gann
- ADXR
- Stochastics
- Volume
- Triangles
- Futures
- Cycles
- Volatility
- ZIGZAG
- MESA
- Retracement
- Aroon
INDICATORS LIST
LIST OF TOPICS
PRINT THIS ARTICLE
by Donald W. Pendergast, Jr.
After printing a beautiful "bear to bull" double bottom transition pattern, the US dollar index is testing support before another leap higher.
Position: N/A
Donald W. Pendergast, Jr.
Freelance financial markets writer and online publisher of the Trendzetterz.com S&P 500 Weekly Forecast service.
PRINT THIS ARTICLE
FLAGS AND PENNANTS
US Dollar Index: Bull Flag On Hourly Chart
02/25/14 04:09:02 PMby Donald W. Pendergast, Jr.
After printing a beautiful "bear to bull" double bottom transition pattern, the US dollar index is testing support before another leap higher.
Position: N/A
| As the old saying goes, "there's always a bull market somewhere" and sometimes you may need to use intraday time frames to find an especially attractive, low-risk buy/short sell trade setup. In the case of the US Dollar index (DXH14, @DX) a nice bull flag/pullback to support setup has printed on its hourly (60-minute) chart, one that should have currency market swing traders' attention. Here's a look now at the pattern and the scanning tool used to locate and identify it. |
|
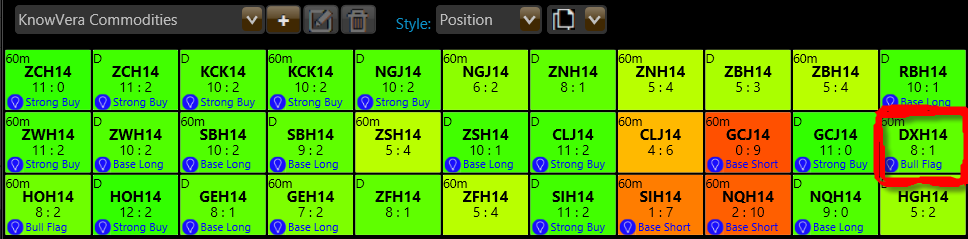
| Figure 1. US Dollar Index futures (DXH14) 60-minute chart's trend monitor cell has plenty of bullish information, more than enough to warrant a close visual inspection of its price chart. |
| Graphic provided by: TradeStation. |
| Graphic provided by: Phantom Trader by KnowVera Research LLC. |
| |
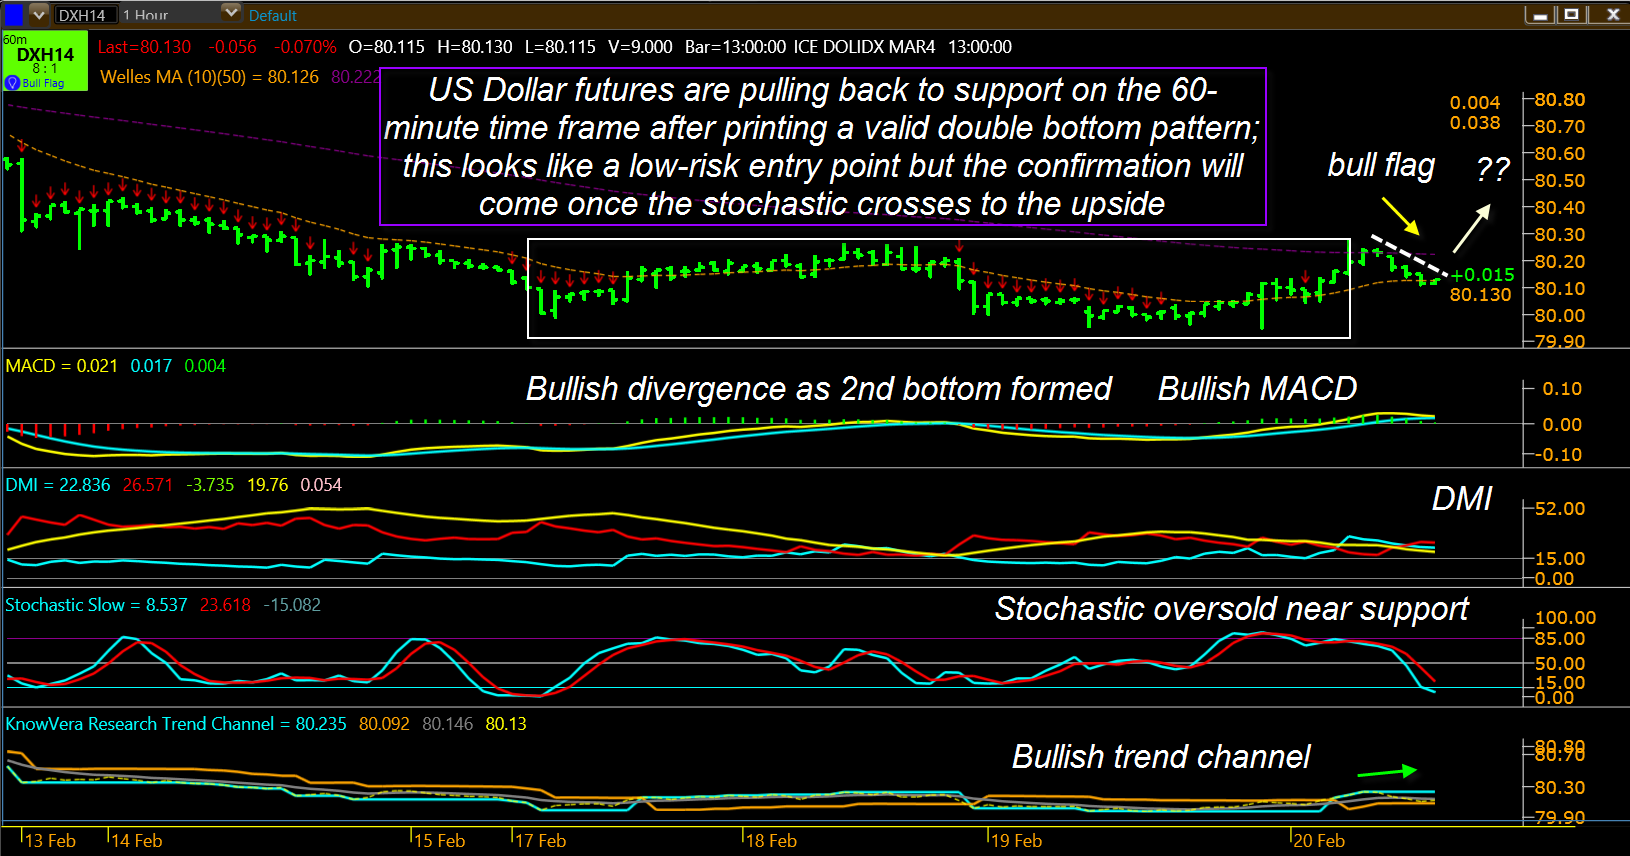
| The Trend Monitor feature within Phantom Trader (Figure 1) allows visual scanning of a wide variety of commodity, currency, and stocks/ETFs across five distinct trading time frames (scalp, day, swing, position, investment) and also uses color coding, trend score, and other commentary to help a trader/investor home in on the lowest risk/highest probability trade setups. Visual scanning of the currencies window on the 'position' time frame revealed that the DXH14 (March '14 US dollar index futures) had the following bullish qualities on its 60-minute time frame: 1. The cell color is bright green (bullish) 2. The Trend Score is 8:1 (also bullish) 3. A bull flag has been automatically identified by the software. For swing traders who like to enter long trades on a pullback to key support areas, the words 'bull flag' are of importance here, so what's next is to click on the cell, which will bring up the 60-minute chart of the contract for visual confirmation (Figure 2). And what a bullish setup we find — the DXH14 has printed a nicely proportioned double bottom pattern, one that clearly identified the change in leadership (on the hourly chart anyway) from the bears to the bulls. First, note the bullish MACD divergence with the price action on the chart — the second bottom is a little lower than the first but the second low in the MACD is much higher and this is usually a confirmation that the "smart money" is building a new long position in anticipation of upcoming gains in a given market. Next, note that the trend channel (bottom of chart) has been in bullish configuration for nearly two weeks now and that the stochastic indicator is deeply oversold. Finally, witness the gradual pullback of the DXH14 toward its 10-bar moving average (gold dashed line) and that it is forming a bull flag as it does so. Clearly, this is a near-textbook quality visual image of a financial instrument that has a high probability of breaking higher on its hourly chart, moving up toward its next key resistance level. |
|
| Figure 2. DXH14's hourly chart reveals a bull flag formation, bullish MACD pattern, rising trend channel and deeply oversold stochastic. |
| Graphic provided by: TradeStation. |
| Graphic provided by: Phantom Trader by KnowVera Research LLC. |
| |
| Here's an idea for playing the US Dollar futures here, using two contracts: 1. Buy one contract on a rise above the last hourly bar on Wednesday at 80.13. 2. Place your initial stop loss 10 ticks beneath Wednesday's low of 80.11 3. Wait for a confirmed close above the dashed resistance line above the bull flag. 4. Enter long your second contract on a break above the high of the bar that closes above the dashed line. Adjust your stop loss quantity. 5. Set your initial profit target somewhere between 80.43 and 80.49, which is the range between chart resistance and the 200-bar moving average price on the hourly time frame. As the trade moves in your favor, use the gold trend channel line as your trailing stop. Trading futures involves the use of margin and should only be attempted by skilled traders with large amounts of risk capital at their disposal, but stock traders can also use a variety of leveraged/non-leveraged ETFss to trade the US dollar index (UUP, for example). If you decide to take this trade, make sure you limit your risk by using the appropriate number of contracts or shares and an intelligent stop loss/profit taking regimen to help keep you in the trading game. Trade wisely until we meet here again. |
Freelance financial markets writer and online publisher of the Trendzetterz.com S&P 500 Weekly Forecast service.
| Title: | Market consultant and writer |
| Company: | Trendzetterz |
| Address: | 81 Hickory Hollow Drive |
| Crossville, TN 38555 | |
| Phone # for sales: | 904-303-4814 |
| Website: | trendzetterz.com |
| E-mail address: | support@trendzetterz.com |
Traders' Resource Links | |
| Trendzetterz has not added any product or service information to TRADERS' RESOURCE. | |
Click here for more information about our publications!
PRINT THIS ARTICLE

Request Information From Our Sponsors
- VectorVest, Inc.
- Executive Premier Workshop
- One-Day Options Course
- OptionsPro
- Retirement Income Workshop
- Sure-Fire Trading Systems (VectorVest, Inc.)
- Trading as a Business Workshop
- VectorVest 7 EOD
- VectorVest 7 RealTime/IntraDay
- VectorVest AutoTester
- VectorVest Educational Services
- VectorVest OnLine
- VectorVest Options Analyzer
- VectorVest ProGraphics v6.0
- VectorVest ProTrader 7
- VectorVest RealTime Derby Tool
- VectorVest Simulator
- VectorVest Variator
- VectorVest Watchdog
- StockCharts.com, Inc.
- Candle Patterns
- Candlestick Charting Explained
- Intermarket Technical Analysis
- John Murphy on Chart Analysis
- John Murphy's Chart Pattern Recognition
- John Murphy's Market Message
- MurphyExplainsMarketAnalysis-Intermarket Analysis
- MurphyExplainsMarketAnalysis-Visual Analysis
- StockCharts.com
- Technical Analysis of the Financial Markets
- The Visual Investor