HOT TOPICS LIST
- MACD
- Fibonacci
- RSI
- Gann
- ADXR
- Stochastics
- Volume
- Triangles
- Futures
- Cycles
- Volatility
- ZIGZAG
- MESA
- Retracement
- Aroon
INDICATORS LIST
LIST OF TOPICS
PRINT THIS ARTICLE
by Gary Grosschadl
The weekly chart shows the overall markets may find some firm footing going forward. A bullish flag has formed coming off a possible bottom.
Position: N/A
Gary Grosschadl
Independent Canadian equities trader and technical analyst based in Peterborough
Ontario, Canada.
PRINT THIS ARTICLE
CHART ANALYSIS
US Dollar Index Shows Some Optimism
10/08/02 01:52:30 PMby Gary Grosschadl
The weekly chart shows the overall markets may find some firm footing going forward. A bullish flag has formed coming off a possible bottom.
Position: N/A
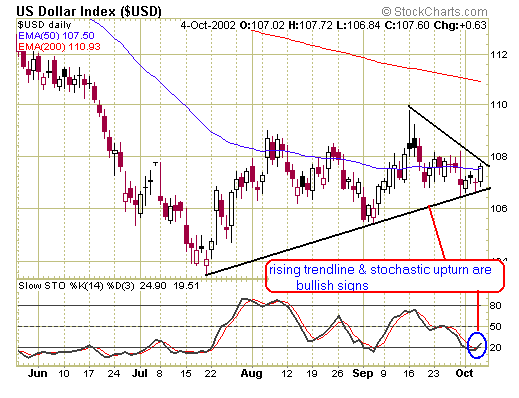
 Figure 1: Daily chart of the USD. Since September the main equities indices have continued to descend but not the US dollar index ($USD). This could be interpreted as a form of bullish divergence. While indices have been hitting new lows, the $USD has not. In fact both the daily and weekly charts show signs of stabilization and one could argue a rising trendline. |

|
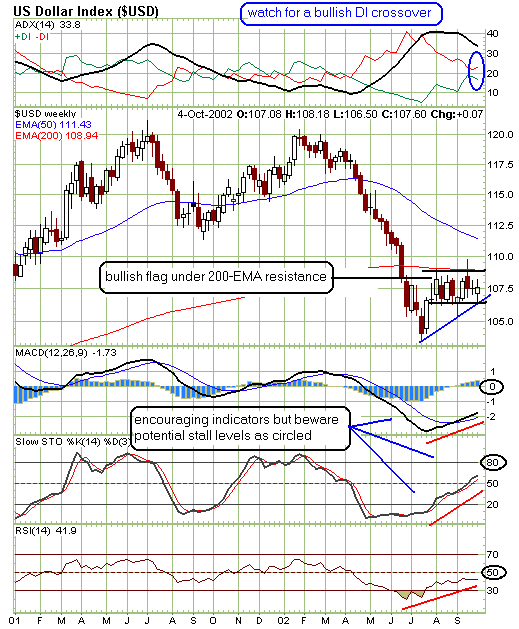
| Figure 2: Weekly chart of the USD. |
| Graphic provided by: stockcharts.com. |
| |
| The weekly chart suggests a bullish flag formation with 200-period EMA acting as important resistance going forward. A move above this 109 resistance could encourage a bullish test of the next resistance level formed by the 50-period EMA, currently at 111.43. This may coincide with potential stall areas as circled on the displayed indicators, the downside danger being a downside violation of the lower trendline falling below 106.5. Look for continuing bullish signs from the $USD to finally encourage the Dow and other main indices to turn upwards. The market is looking for an excuse to bottom and move higher, and improving strength of the greenback could be a catalyst. |
Independent Canadian equities trader and technical analyst based in Peterborough
Ontario, Canada.
| Website: | www.whatsonsale.ca/financial.html |
| E-mail address: | gwg7@sympatico.ca |
Click here for more information about our publications!
Comments
Date: 10/10/02Rank: Comment: Gary: I interpret the rising STOCH against the sideways dollar as bearish. This shows up nicely on Foxinvestments.com futures chart (a free website) of the dollar (weekly). Bettywurm.com
Date: 10/11/02Rank: 5Comment:
Date: 10/12/02Rank: 4Comment:
Date: 10/15/02Rank: 5Comment: good work
Date: 10/15/02Rank: 5Comment: good work

Request Information From Our Sponsors
- StockCharts.com, Inc.
- Candle Patterns
- Candlestick Charting Explained
- Intermarket Technical Analysis
- John Murphy on Chart Analysis
- John Murphy's Chart Pattern Recognition
- John Murphy's Market Message
- MurphyExplainsMarketAnalysis-Intermarket Analysis
- MurphyExplainsMarketAnalysis-Visual Analysis
- StockCharts.com
- Technical Analysis of the Financial Markets
- The Visual Investor
- VectorVest, Inc.
- Executive Premier Workshop
- One-Day Options Course
- OptionsPro
- Retirement Income Workshop
- Sure-Fire Trading Systems (VectorVest, Inc.)
- Trading as a Business Workshop
- VectorVest 7 EOD
- VectorVest 7 RealTime/IntraDay
- VectorVest AutoTester
- VectorVest Educational Services
- VectorVest OnLine
- VectorVest Options Analyzer
- VectorVest ProGraphics v6.0
- VectorVest ProTrader 7
- VectorVest RealTime Derby Tool
- VectorVest Simulator
- VectorVest Variator
- VectorVest Watchdog
