HOT TOPICS LIST
- MACD
- Fibonacci
- RSI
- Gann
- ADXR
- Stochastics
- Volume
- Triangles
- Futures
- Cycles
- Volatility
- ZIGZAG
- MESA
- Retracement
- Aroon
INDICATORS LIST
LIST OF TOPICS
PRINT THIS ARTICLE
by Koos van der Merwe
Every now and again, a share captures your attention as an indicator triggers a buy or a sell.
Position: Sell
Koos van der Merwe
Has been a technical analyst since 1969, and has worked as a futures and options trader with First Financial Futures in Johannesburg, South Africa.
PRINT THIS ARTICLE
VOLUME
A Share To Keep An Eye On
02/24/14 04:32:07 PMby Koos van der Merwe
Every now and again, a share captures your attention as an indicator triggers a buy or a sell.
Position: Sell
| Cal-Maine Foods, Inc. is a fresh egg producer, established in 1969 and based in Jackson, Mississippi, in the United States. Its eggs are sold mostly in mid-Atlantic, midwestern, southeastern, and southwestern states. On February the 17, 2014, with the stock market closed while the US celebrated Presidents' Day, the company announced that it had reached an agreement to acquire 50 percent of the membership interests of Delta Egg Farm, LLC from Sunbest Foods of Iowa, Inc. The company currently owns the remaining 50 percent of Delta Egg Farm, LLC, so the entity will become a wholly owned subsidiary of the company. Pursuant to this agreement, Cal-Maine Foods will purchase the membership interests for a total of $17.0 million. Delta Egg Farm, LLC owns and operates a feed mill and egg production complex with capacity for approximately 1.2 million laying hens, located near Delta, Utah, and an organic egg production complex with capacity for approximately 400,000 laying hens located near Chase, Kansas. The company expects to close the transaction effective March 1, 2014. The typical trend when a company announces a purchase is a fall in the share price. So you can expect the share price to fall when the market trades on February 18, 2014. Does this present a buying opportunity? |

|
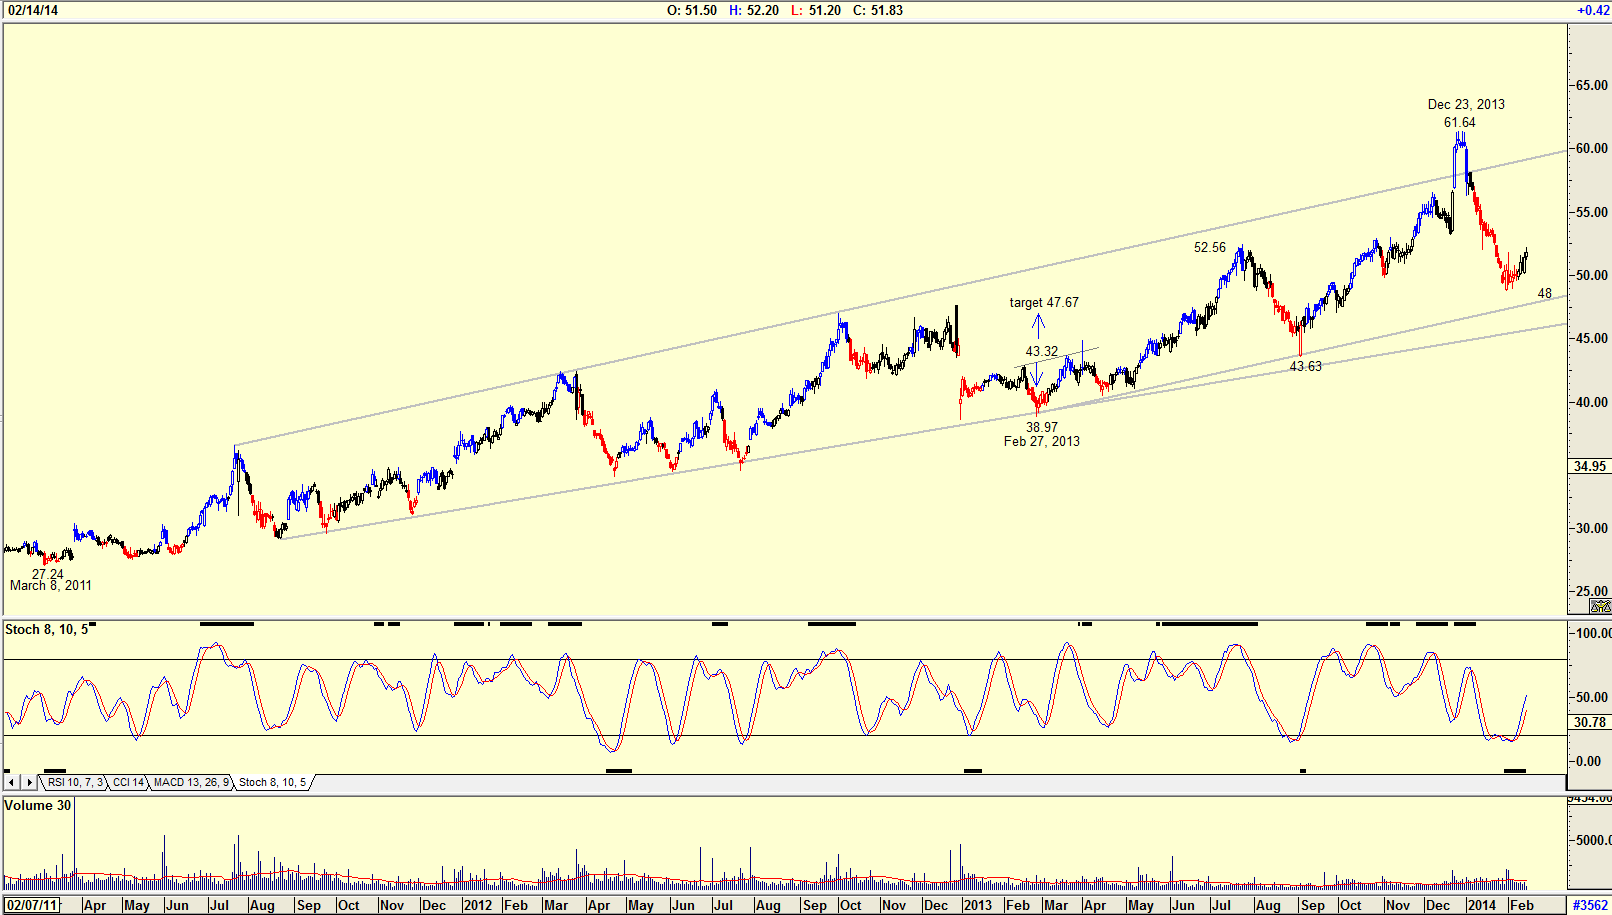
| Figure 1. Daily chart of Calmaine Foods. |
| Graphic provided by: AdvancedGET. |
| |
| The daily chart in Figure 1 shows how the share price rose from a low of $27.24 on March 8, 2011 to a high of $61.64 by December 23, 2013. Note that the share price broke above the upper trend line to reach this high, but quickly fell below it, tested it, and then fell further. The original upper and lower trend lines were in a broadening formation, suggesting uncertainty, but from February 27, 2013, a lower trend line parallel to the upper trend line formed. This suggests that price could fall to test the lower trend line at the $48 level. Note the head & shoulders pattern that formed on February 27, 2013 suggesting a target of $47.67 (43.32 - 38.97 = 4.35 + 43.32 = 47.67). The price rose to $52.56 before falling back to $43.63. Note the buy and sell signals given by the stochastic indicator. |

|
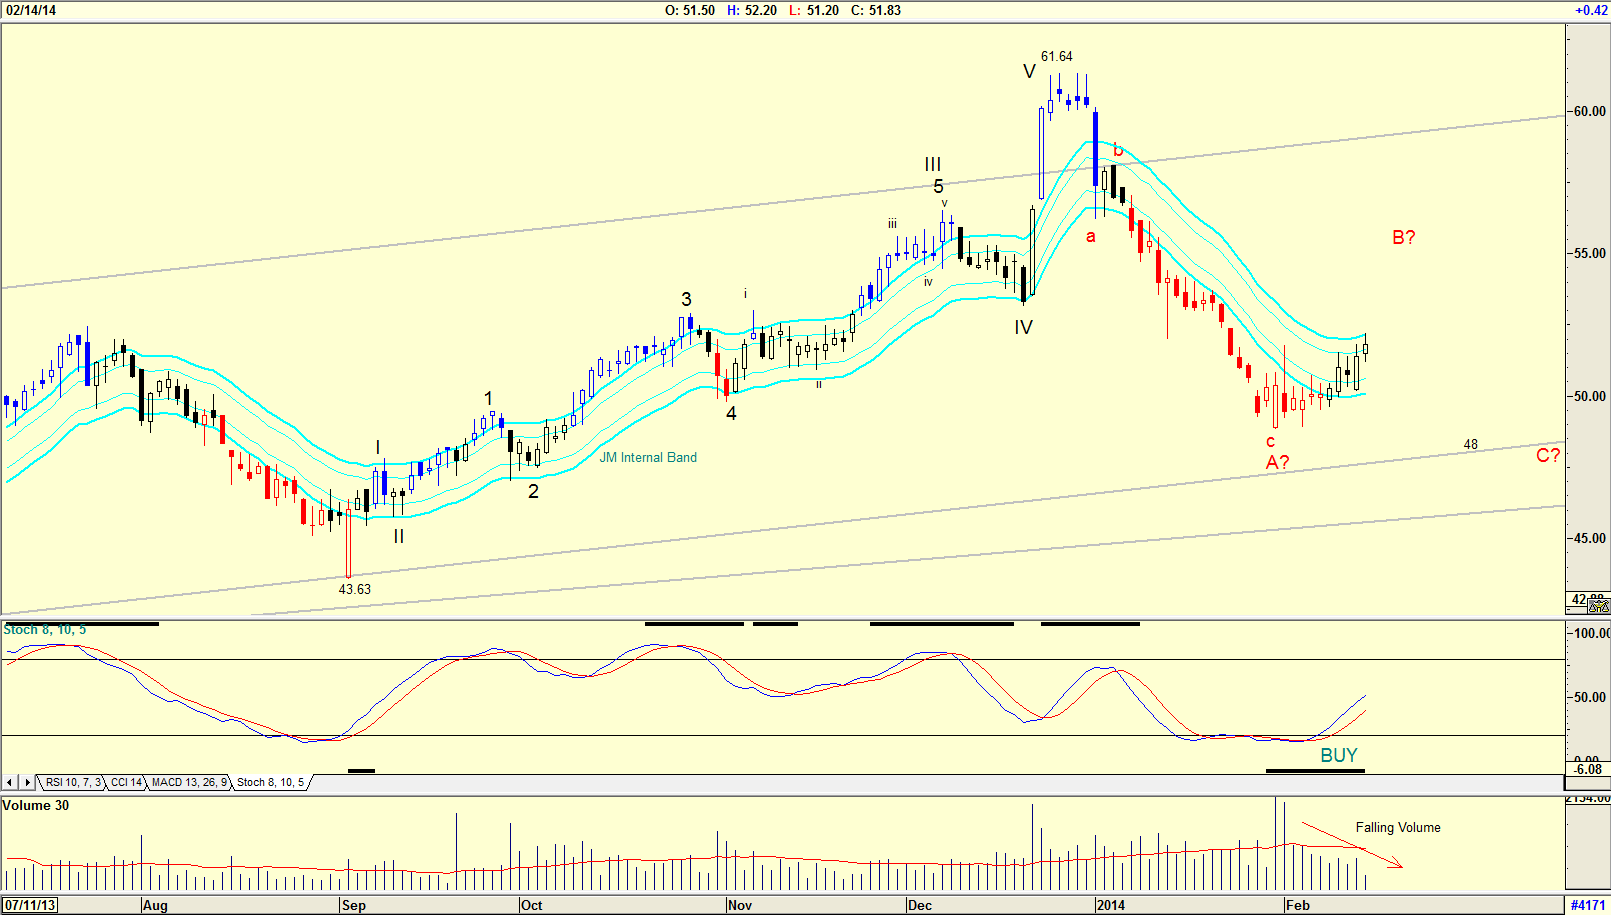
| Figure 2. Daily chart of Calmaine Foods with Elliott Wave count and JM Internal Band indicator. |
| Graphic provided by: AdvancedGET. |
| |
| The chart in Figure 2 displays an enlarged daily chart showing an Elliott Wave count, stochastic indicators, volume, and the JM Internal band indicator. The Elliott Wave count suggests that a c-wave bottom has been reached, but there is uncertainty because the price is above the support line. The ABC pattern could occur. The stochastic indicator has given a buy signal and the share price has moved up; however, the falling volume as the price rose suggests weakness. Finally the price has not risen above the upper line of the JM Internal Band indicator giving a buy signal for the more conservative investors. The JM Internal Band indicator is a 15-period simple moving average offset by 2% positive and 2% negative. Because of the falling volume as the share price rose, I would not have been a buyer of the share in spite of a buy signal given by the stochastic indicator. Should the share price break above the JM Internal Band upper line, I may consider it, but I would be nervous, and the maxim, "when in doubt, stay out" comes to mind. Nevertheless, this is a share worth watching, especially now with their new purchase. |
Has been a technical analyst since 1969, and has worked as a futures and options trader with First Financial Futures in Johannesburg, South Africa.
| Address: | 3256 West 24th Ave |
| Vancouver, BC | |
| Phone # for sales: | 6042634214 |
| E-mail address: | petroosp@gmail.com |
Click here for more information about our publications!
Comments
Date: 02/26/14Rank: 4Comment:

Request Information From Our Sponsors
- VectorVest, Inc.
- Executive Premier Workshop
- One-Day Options Course
- OptionsPro
- Retirement Income Workshop
- Sure-Fire Trading Systems (VectorVest, Inc.)
- Trading as a Business Workshop
- VectorVest 7 EOD
- VectorVest 7 RealTime/IntraDay
- VectorVest AutoTester
- VectorVest Educational Services
- VectorVest OnLine
- VectorVest Options Analyzer
- VectorVest ProGraphics v6.0
- VectorVest ProTrader 7
- VectorVest RealTime Derby Tool
- VectorVest Simulator
- VectorVest Variator
- VectorVest Watchdog
- StockCharts.com, Inc.
- Candle Patterns
- Candlestick Charting Explained
- Intermarket Technical Analysis
- John Murphy on Chart Analysis
- John Murphy's Chart Pattern Recognition
- John Murphy's Market Message
- MurphyExplainsMarketAnalysis-Intermarket Analysis
- MurphyExplainsMarketAnalysis-Visual Analysis
- StockCharts.com
- Technical Analysis of the Financial Markets
- The Visual Investor
