HOT TOPICS LIST
- MACD
- Fibonacci
- RSI
- Gann
- ADXR
- Stochastics
- Volume
- Triangles
- Futures
- Cycles
- Volatility
- ZIGZAG
- MESA
- Retracement
- Aroon
INDICATORS LIST
LIST OF TOPICS
PRINT THIS ARTICLE
by Koos van der Merwe
With Obamacare taking center stage in the US, should you start buying shares in health insurance companies?
Position: Buy
Koos van der Merwe
Has been a technical analyst since 1969, and has worked as a futures and options trader with First Financial Futures in Johannesburg, South Africa.
PRINT THIS ARTICLE
ELLIOTT WAVE
Having A Look At Aflac
02/21/14 04:25:41 PMby Koos van der Merwe
With Obamacare taking center stage in the US, should you start buying shares in health insurance companies?
Position: Buy
| Aflac Incorporated (AFL) is the largest provider of supplemental insurance in the United States. Their advertising on TV with a goose that quacks captures everyone's attention. Is it a share that should capture your attention? Is the share a buy at the present price? |

|
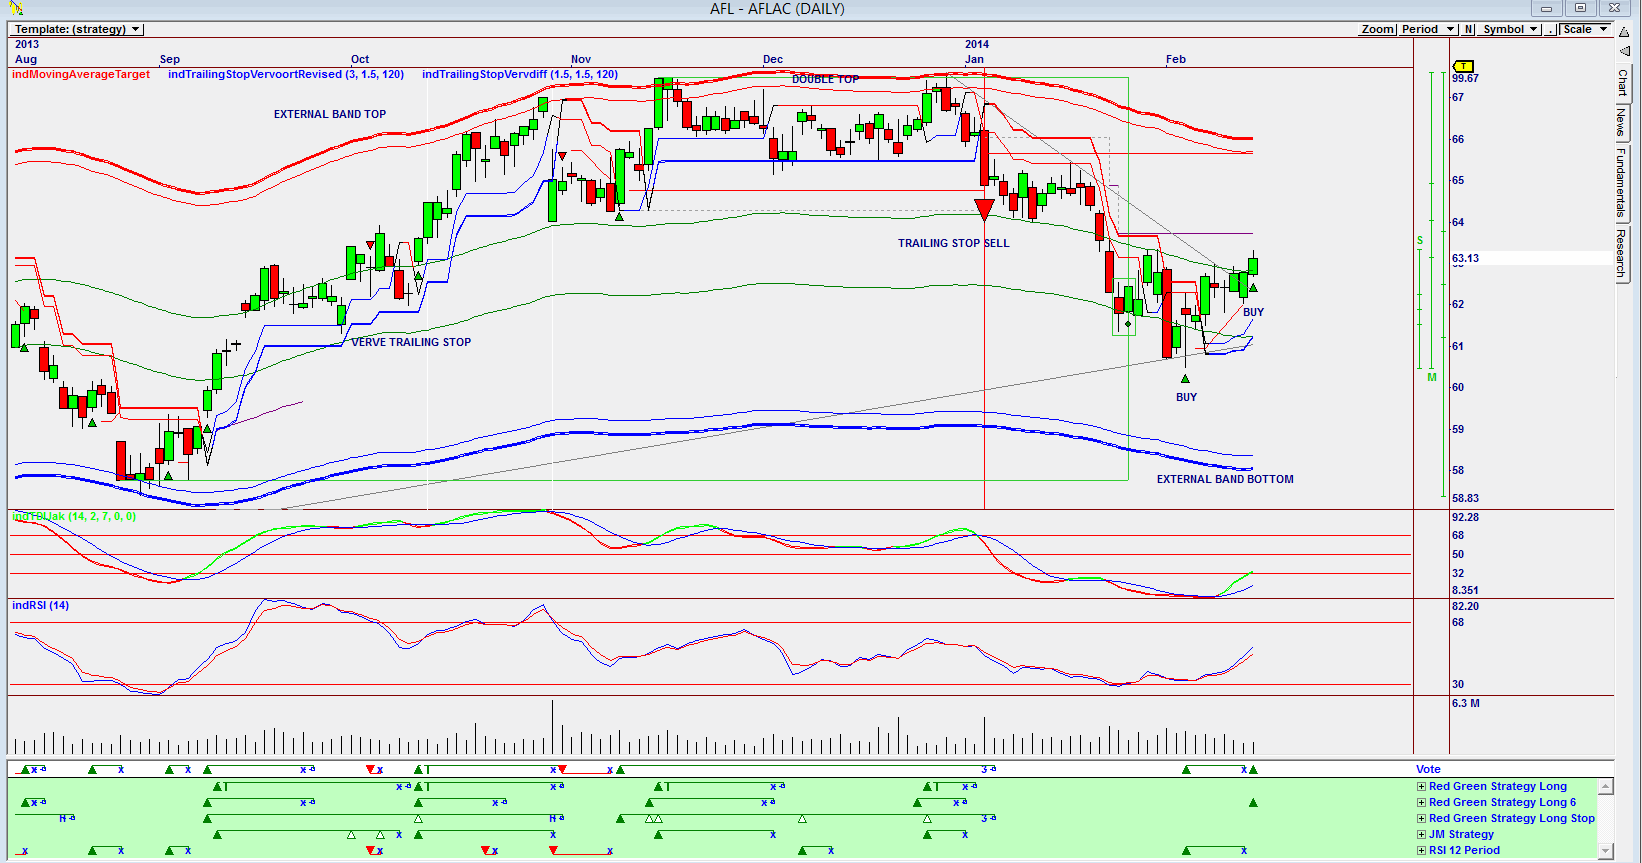
| Figure 1. An Omnitrader chart of AFL showing the buy signal on the Vote line. |
| Graphic provided by: Omnitrader. |
| |
| The chart in Figure 1 is an Omnitrader chart that brought AFL to my attention as a buy. The chart shows a Vote line buy signal given by the Red Green Strategy Long 6. Note the double top signal given in January. Also note the sell signal given when the share price dropped below the Verve trailing stop. Note also the buy signal given by the two indicators, the TDIJak and RSI (14). Finally, I would have preferred a buy signal with the price falling to the external band bottom. The target given by the external band top is $66, a target that could be met. |

|
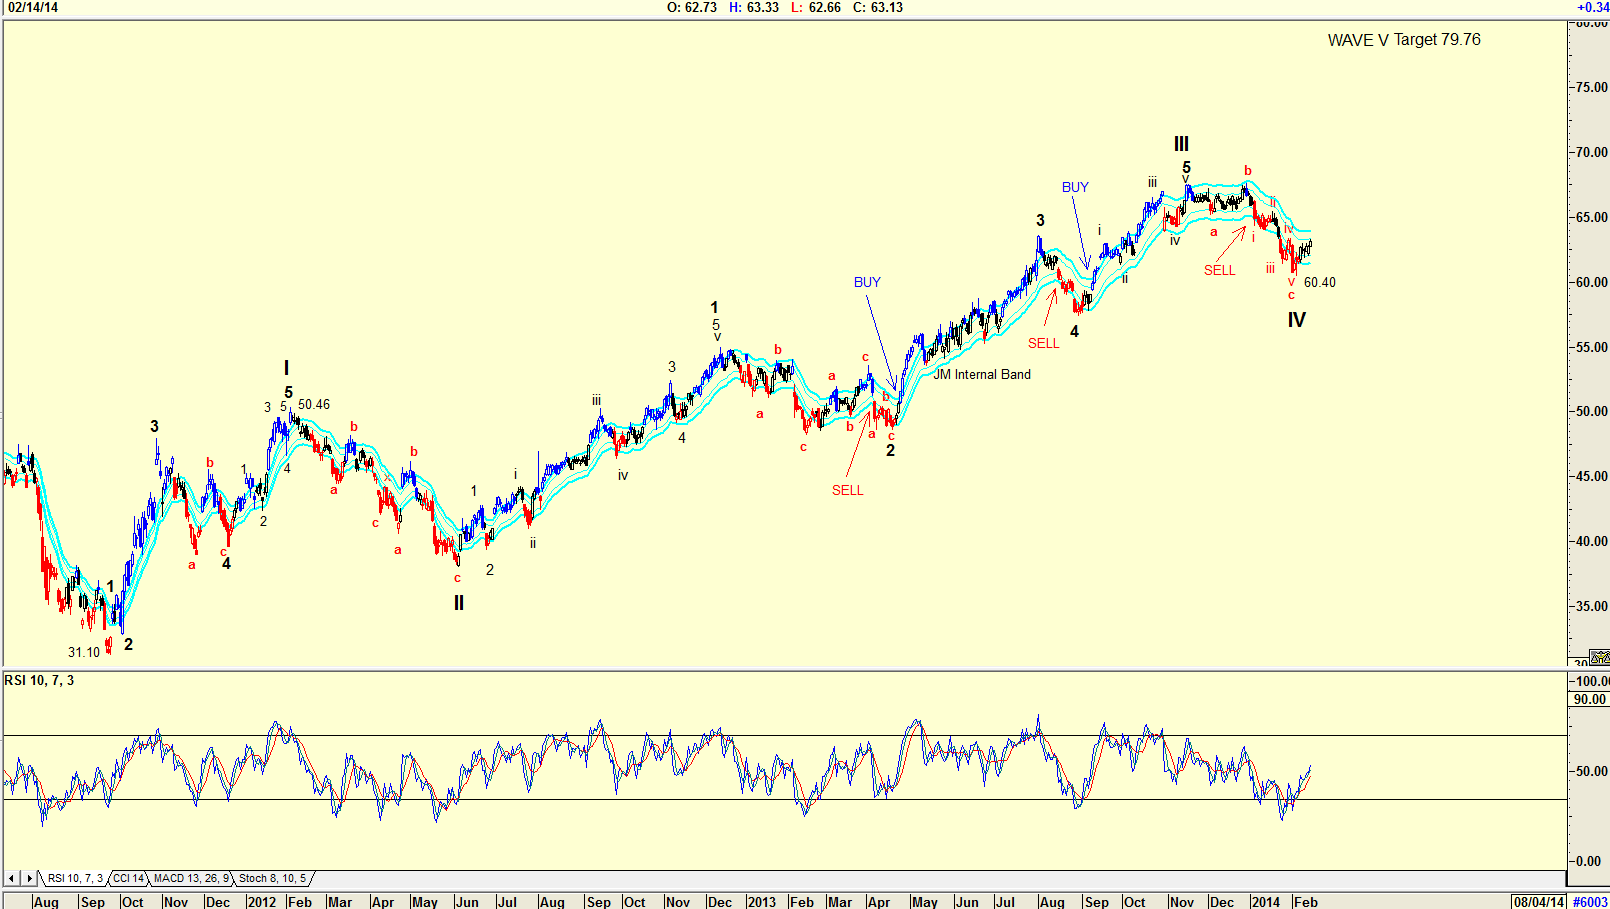
| Figure 2. Daily chart of AFL with an Elliott Wave count. |
| Graphic provided by: AdvancedGET. |
| |
| The daily chart in Figure 2 is an Elliott Wave count of AFL, suggesting a target of $79.76 for a WAVE V top. This is because of a rule in Elliott Wave theory that a wave 5 should be equal to a wave 1. (50.46 - 31.10 = 19.36 + 60.40 = 79.76). The target may not necessarily be reached, but it does give you an idea of where the share price could go. Finally, note that RSI is trending upwards after having given a buy signal. Also note that price has not given a JM Internal Band buy. A JM Internal Band is a 15-period simple moving average offset by 2% positive and 2% negative. A buy signal is given when the price breaks above the upper band. This is a conservative indicator. I would be a buyer of AFL at current levels expecting a rise above the WAVE III top. |
Has been a technical analyst since 1969, and has worked as a futures and options trader with First Financial Futures in Johannesburg, South Africa.
| Address: | 3256 West 24th Ave |
| Vancouver, BC | |
| Phone # for sales: | 6042634214 |
| E-mail address: | petroosp@gmail.com |
Click here for more information about our publications!
PRINT THIS ARTICLE

Request Information From Our Sponsors
- StockCharts.com, Inc.
- Candle Patterns
- Candlestick Charting Explained
- Intermarket Technical Analysis
- John Murphy on Chart Analysis
- John Murphy's Chart Pattern Recognition
- John Murphy's Market Message
- MurphyExplainsMarketAnalysis-Intermarket Analysis
- MurphyExplainsMarketAnalysis-Visual Analysis
- StockCharts.com
- Technical Analysis of the Financial Markets
- The Visual Investor
- VectorVest, Inc.
- Executive Premier Workshop
- One-Day Options Course
- OptionsPro
- Retirement Income Workshop
- Sure-Fire Trading Systems (VectorVest, Inc.)
- Trading as a Business Workshop
- VectorVest 7 EOD
- VectorVest 7 RealTime/IntraDay
- VectorVest AutoTester
- VectorVest Educational Services
- VectorVest OnLine
- VectorVest Options Analyzer
- VectorVest ProGraphics v6.0
- VectorVest ProTrader 7
- VectorVest RealTime Derby Tool
- VectorVest Simulator
- VectorVest Variator
- VectorVest Watchdog
