HOT TOPICS LIST
- MACD
- Fibonacci
- RSI
- Gann
- ADXR
- Stochastics
- Volume
- Triangles
- Futures
- Cycles
- Volatility
- ZIGZAG
- MESA
- Retracement
- Aroon
INDICATORS LIST
LIST OF TOPICS
PRINT THIS ARTICLE
by Donald W. Pendergast, Jr.
Down by nearly 93% in less than 14 months, shares of Allied Nevada Gold have formed a major base prior to a new rally phase.
Position: N/A
Donald W. Pendergast, Jr.
Freelance financial markets writer and online publisher of the Trendzetterz.com S&P 500 Weekly Forecast service.
PRINT THIS ARTICLE
CHART ANALYSIS
Allied Nevada Gold: Solid Base For Next Rally
02/21/14 04:18:47 PMby Donald W. Pendergast, Jr.
Down by nearly 93% in less than 14 months, shares of Allied Nevada Gold have formed a major base prior to a new rally phase.
Position: N/A
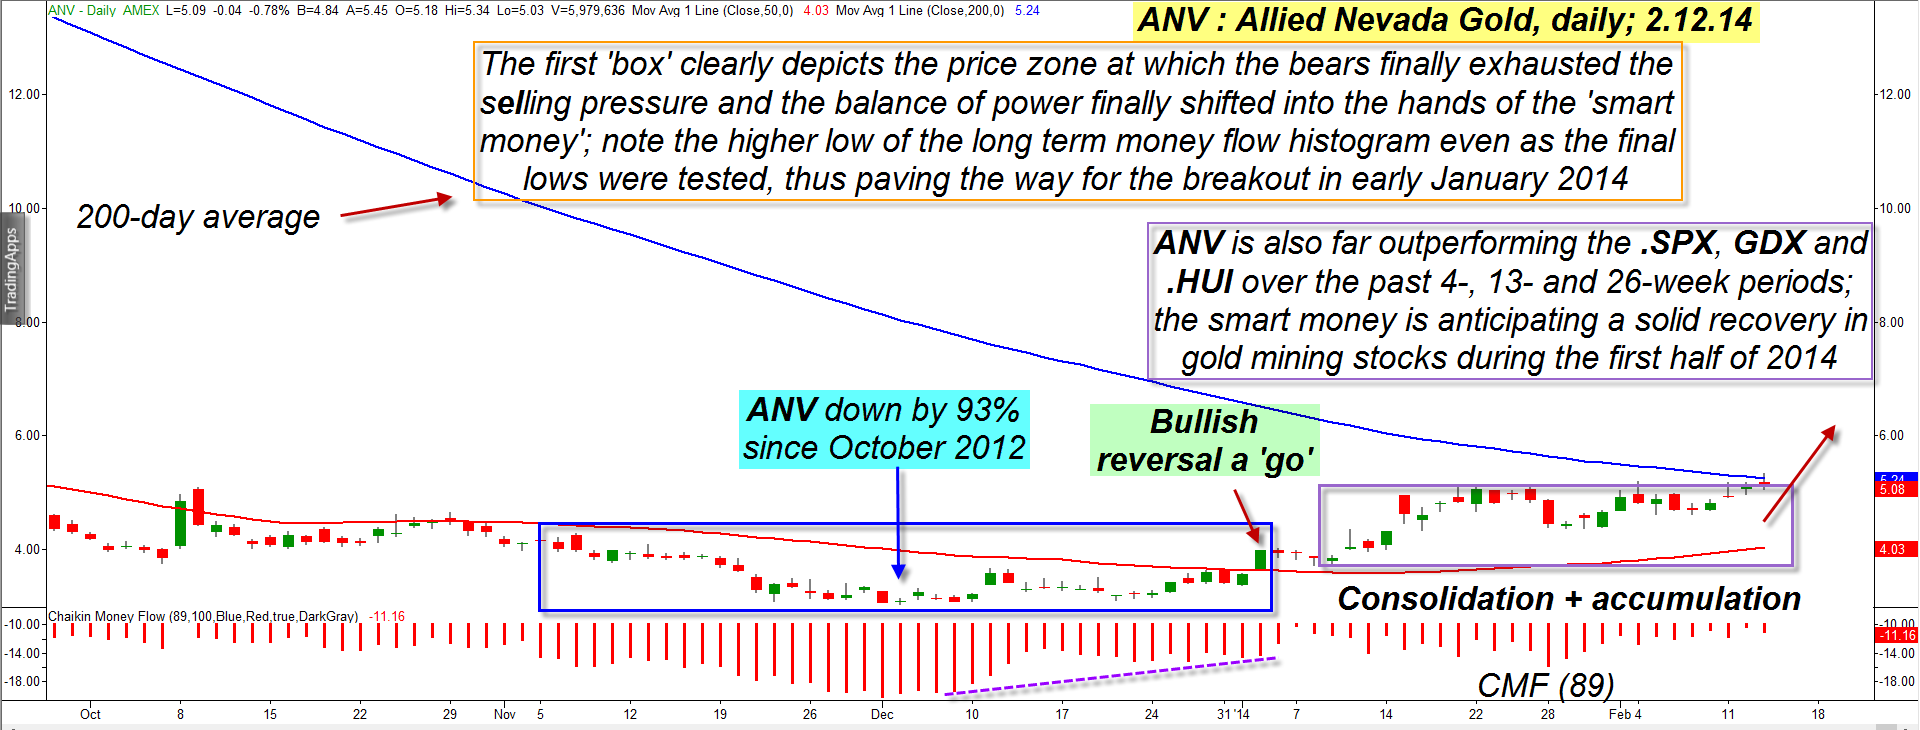
| Buying stocks after they've gone through a devastating bear market can take some courage, but if certain accumulation/reversal patterns are evident, the process becomes less risky with substantially greater potential for long-term profits. Here's a closer look at the recent price action in Allied Nevada Gold, using its daily chart (Figure 1). |

|
| Figure 1. Allied Nevada Gold (ANV) really got hammered between late 2012 and late 2013, but the "smart money" has already tipped its hand, revealing their intent to drive the stock higher for the foreseeable future. |
| Graphic provided by: TradeStation. |
| |
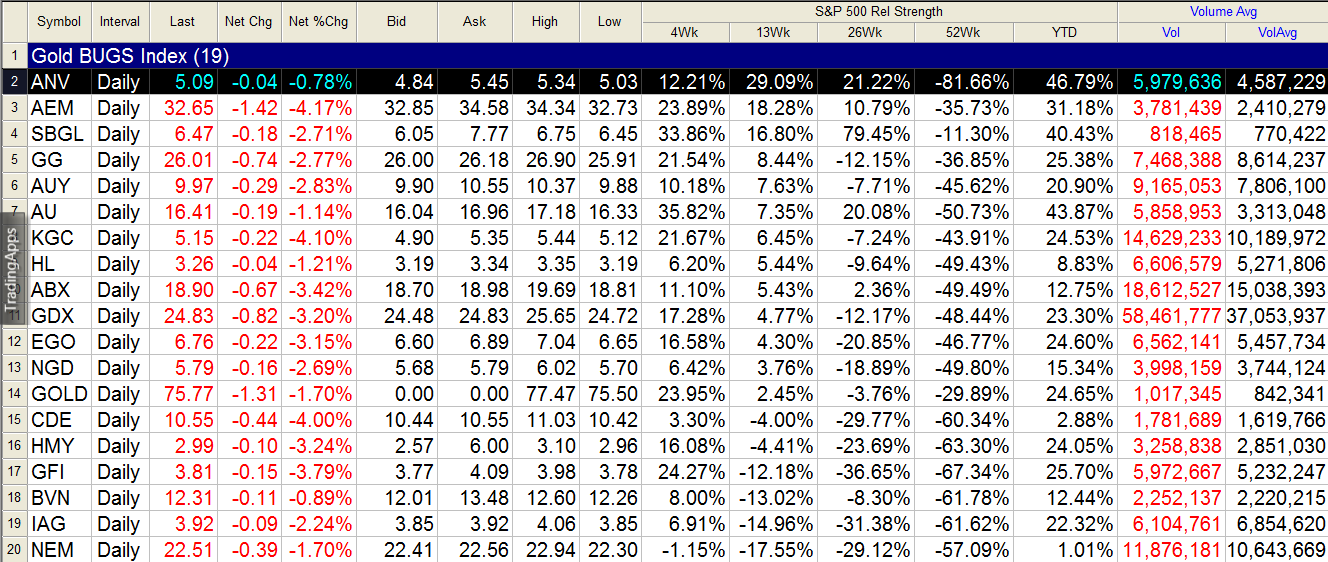
| The slide that began in gold and gold mining stocks since the peak in October 2011 and which lasted until December 2013 was very severe, particularly for a large number of the stocks that populate the Gold Bugs index (.HUI, GDX); in the case of Allied Nevada Gold (ANV) the stock lost nearly 93% of its value during that time, finally cratering at a bargain-bin basement low price of only 3.01 per share on December 4, 2013. A 93% decline in a mere 13.5 months is pretty dramatic; why would anyone in their right mind even think about buying shares in such an out of favor gold miner, much less put real cash to work, attempting to build a new long position? Well, consider these reasons: 1. The stock is manifesting clear and powerful signs of the bears finally giving up their shorting campaign. 2. Clear evidence of a change in control from the bears to the powerful "smart money" interests in the market. 3. The majority of the issues in the stock's industry group (in this case, high volume gold mining shares) are also manifesting similar signs of bear-to-bull transition. Just look at the telltale price action on ANV's daily chart between early November 2013 and early January 2014 (first rectangle on left); note how there was a final descent down into the lower $3 area by early December 2013, where the money flow histogram (based on the 89-day Chaikin Money flow or CMF (89)) dropped in sympathy with the price of ANV. But then all through December and into January 2014 the histogram began to rise dramatically even though the price kept going sideways within the rectangle. This is precisely where the bulls called it quits and the smart money plan of ongoing accumulation finally kicked into gear and was laid the foundation for the powerful breakout move on January 4, 2014. At this point the line of least resistance for ANV became toward more gains — and with minimal downside risk. The smart money has continued to pile into ANV, building a long position in anticipation of even bigger gains into the second half of 2014. Note that the red 50-day average (SMA) is curving higher for the longest number of days since the rout in ANV began in late 2012 and that it is also trading near its 200-day average for the first time in more than a year. These are all solid confirmations that the bullish reversal is real and that institutional players will want to keep adding ANV and other gold miners to their portfolios in the weeks and months ahead. ANV, along with 75% of all other stocks in the .HUI (ARCA Gold Bugs index) is outperforming the S&P 500 index (.SPX, SPY) by a wide margin over the past 4-, 13- and 26-week periods, and this is also a major confirmation that the big money folks are confident in the future price performance of this heavily beaten-down market group. Other gold miners to watch for more gains include SBGL, AEM, GG, AU and AUY (Figure 2). |

|
| Figure 2. ANV is easily outperforming the .SPX (S&P 500 index) over the past 4- , 13- and 26-week periods, with many other gold miners also beginning to rise after major declines. |
| Graphic provided by: TradeStation. |
| Graphic provided by: TradeStation RadarScreen. |
| |
| Perhaps the simplest way to play ANV here is to go the near term covered call (CC) route, using the March '14 ANV $5 call option(s). These calls have a decent bid/ask spread, a huge open interest figure of 11,307 contracts, and traded more than 700 contracts in the prior session. Daily time decay (theta) is $1 per day/per contract. You may want to wait for ANV to close above its 200-day average before putting on the CC and to then use the 21-day average as your trailing stop loss for the life of the trade. If the trade proves successful, put on another CC using the June '14 calls again, using the strike that is closest to the current price of the stock then; again, trail it with the 21-day average until you're stopped out or have the stock called away. Gold miners look like a good value play for the next four to six months. Trade wisely until we meet here again. |
Freelance financial markets writer and online publisher of the Trendzetterz.com S&P 500 Weekly Forecast service.
| Title: | Market consultant and writer |
| Company: | Trendzetterz |
| Address: | 81 Hickory Hollow Drive |
| Crossville, TN 38555 | |
| Phone # for sales: | 904-303-4814 |
| Website: | trendzetterz.com |
| E-mail address: | support@trendzetterz.com |
Traders' Resource Links | |
| Trendzetterz has not added any product or service information to TRADERS' RESOURCE. | |
Click here for more information about our publications!
Comments

Request Information From Our Sponsors
- StockCharts.com, Inc.
- Candle Patterns
- Candlestick Charting Explained
- Intermarket Technical Analysis
- John Murphy on Chart Analysis
- John Murphy's Chart Pattern Recognition
- John Murphy's Market Message
- MurphyExplainsMarketAnalysis-Intermarket Analysis
- MurphyExplainsMarketAnalysis-Visual Analysis
- StockCharts.com
- Technical Analysis of the Financial Markets
- The Visual Investor
- VectorVest, Inc.
- Executive Premier Workshop
- One-Day Options Course
- OptionsPro
- Retirement Income Workshop
- Sure-Fire Trading Systems (VectorVest, Inc.)
- Trading as a Business Workshop
- VectorVest 7 EOD
- VectorVest 7 RealTime/IntraDay
- VectorVest AutoTester
- VectorVest Educational Services
- VectorVest OnLine
- VectorVest Options Analyzer
- VectorVest ProGraphics v6.0
- VectorVest ProTrader 7
- VectorVest RealTime Derby Tool
- VectorVest Simulator
- VectorVest Variator
- VectorVest Watchdog
