HOT TOPICS LIST
- MACD
- Fibonacci
- RSI
- Gann
- ADXR
- Stochastics
- Volume
- Triangles
- Futures
- Cycles
- Volatility
- ZIGZAG
- MESA
- Retracement
- Aroon
INDICATORS LIST
LIST OF TOPICS
PRINT THIS ARTICLE
by Koos van der Merwe
Having a look at regional banks for a possible buy.
Position: Buy
Koos van der Merwe
Has been a technical analyst since 1969, and has worked as a futures and options trader with First Financial Futures in Johannesburg, South Africa.
PRINT THIS ARTICLE
RSI
A Look At Regional Banking
02/20/14 04:14:50 PMby Koos van der Merwe
Having a look at regional banks for a possible buy.
Position: Buy
| When we look at a bank, we always think of the big banks, like JP Morgan Chase, Wells Fargo, Citi Group and Morgan Stanley. But what about the regional banks, those small banks throughout the country? Yes, there are a number of regional bank ETFs. The preferred list of 6 ETFs are: KRE, SPDR Regional Banking; IAT iShares Dow Jones US Regional Banks Index Fund; KBWR, KBW Regional Banking Portfolio; KRU, ProShares Ultra KBW Regional Banking; RKH Market Vectors Bank and Brokerage ETF; KRS ProShares Short KBW Regional Banking. There may be newly issued ETF's not shown above. In this article, I shall only be looking at KRE, the SPDR Regional Banking. |

|
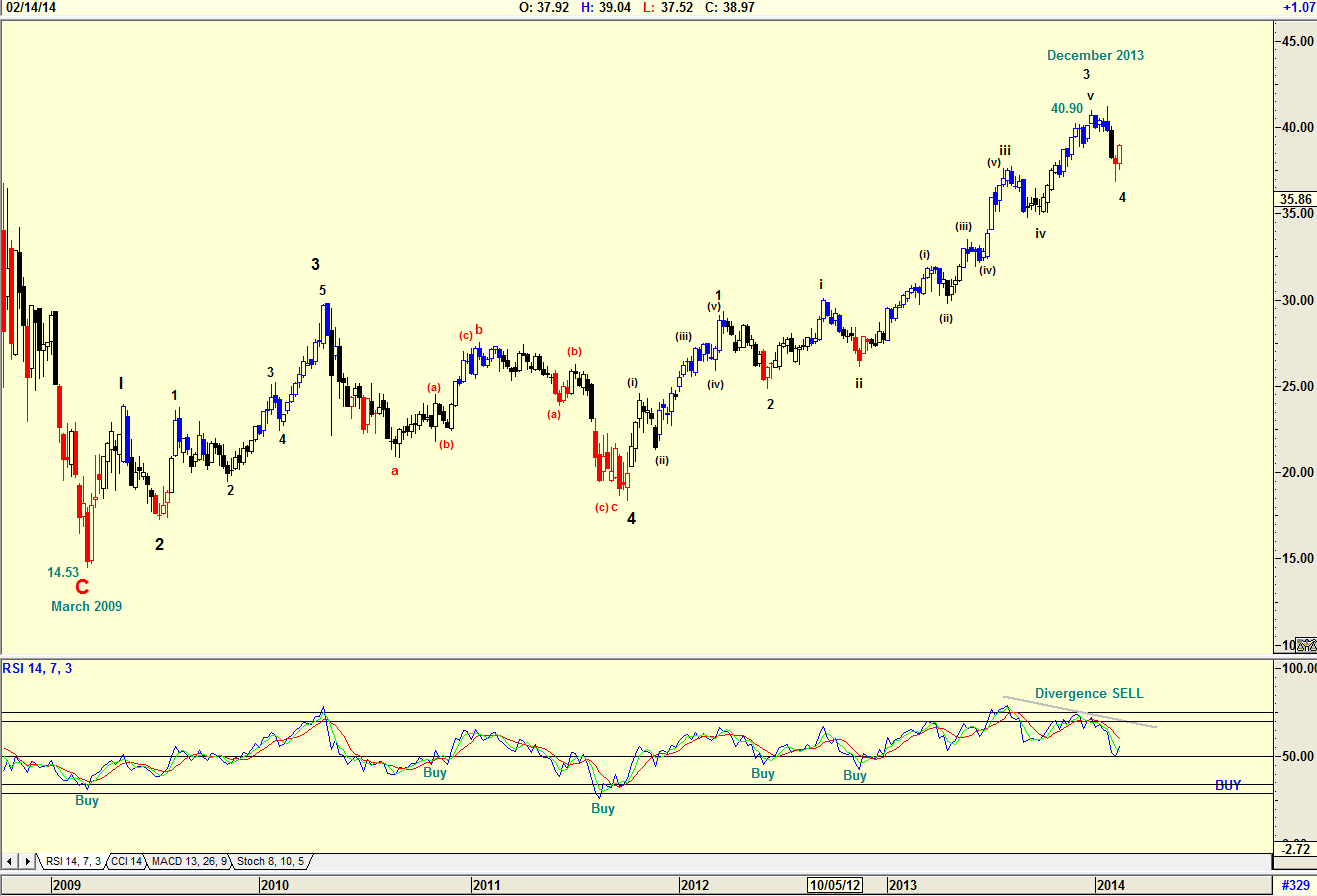
| Figure 1. Weekly chart of KRE with Elliott Wave count. |
| Graphic provided by: AdvancedGET. |
| |
| The chart in Figure 1 is a weekly chart of KRE showing how the price moved from $14.53 in March 2009 to $40.90 by December 2013. The Elliott Wave count is suggesting that the ETF is starting to move into a Wave 5 of WAVE 5. The RSI index however was in an overbought position and gave a divergence sell signal, that is where the ETF rises to higher levels, while the RSI moves to lower levels. A look back at previous RSI signals does show that buy signals were triggered when the index fell below and then rose above the 50 horizontal line. The RSI has not fallen below the 50 horizontal line suggesting that the Wave 4 of WAVE 5 may not be completed, and that we could expect further weakness. |

|
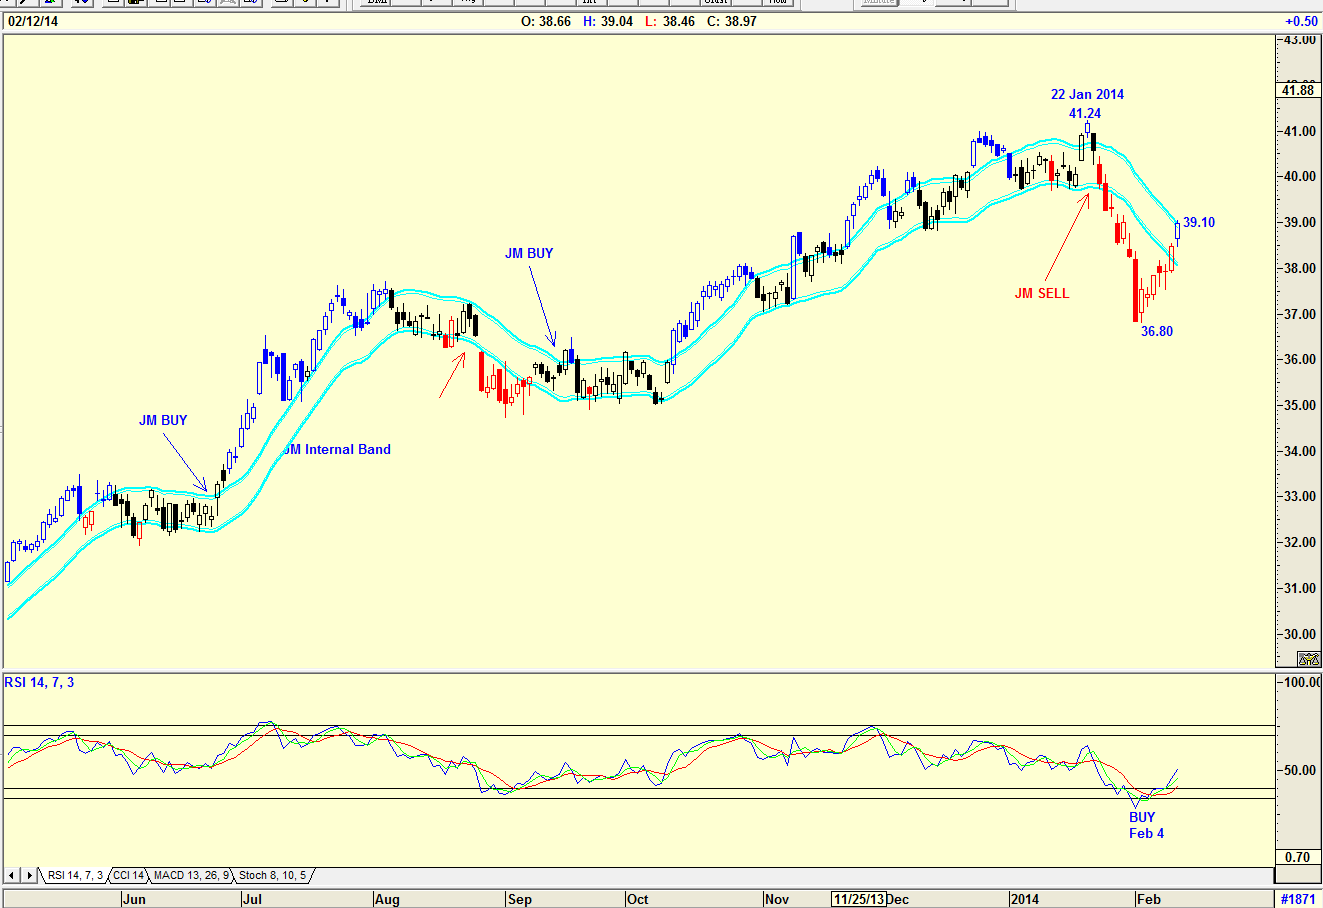
| Figure 2. Daily chart for KRE. |
| Graphic provided by: AdvancedGET. |
| |
| Looking at the daily chart we can see that the RSI indicator has given a buy signal on February 4th. More conservative investors can wait for a buy signal to be triggered when the price moves above the upper band of the JM Internal Band. The JM Internal Band indicator is a 15 period simple moving average offset by 2% positive and 2% negative. Yes, I would be a buyer of KRE at present levels, with a resistance target at $41.24, the high reached on January 22nd, 2014. |
Has been a technical analyst since 1969, and has worked as a futures and options trader with First Financial Futures in Johannesburg, South Africa.
| Address: | 3256 West 24th Ave |
| Vancouver, BC | |
| Phone # for sales: | 6042634214 |
| E-mail address: | petroosp@gmail.com |
Click here for more information about our publications!
PRINT THIS ARTICLE

Request Information From Our Sponsors
- StockCharts.com, Inc.
- Candle Patterns
- Candlestick Charting Explained
- Intermarket Technical Analysis
- John Murphy on Chart Analysis
- John Murphy's Chart Pattern Recognition
- John Murphy's Market Message
- MurphyExplainsMarketAnalysis-Intermarket Analysis
- MurphyExplainsMarketAnalysis-Visual Analysis
- StockCharts.com
- Technical Analysis of the Financial Markets
- The Visual Investor
- VectorVest, Inc.
- Executive Premier Workshop
- One-Day Options Course
- OptionsPro
- Retirement Income Workshop
- Sure-Fire Trading Systems (VectorVest, Inc.)
- Trading as a Business Workshop
- VectorVest 7 EOD
- VectorVest 7 RealTime/IntraDay
- VectorVest AutoTester
- VectorVest Educational Services
- VectorVest OnLine
- VectorVest Options Analyzer
- VectorVest ProGraphics v6.0
- VectorVest ProTrader 7
- VectorVest RealTime Derby Tool
- VectorVest Simulator
- VectorVest Variator
- VectorVest Watchdog
