

HOT TOPICS LIST
- MACD
- Fibonacci
- RSI
- Gann
- ADXR
- Stochastics
- Volume
- Triangles
- Futures
- Cycles
- Volatility
- ZIGZAG
- MESA
- Retracement
- Aroon
INDICATORS LIST
LIST OF TOPICS
PRINT THIS ARTICLE
by Donald W. Pendergast, Jr.
Shares of Diamond Offshore Drilling are off by more than 30% since July 2013 but have begun to bounce from major support.
Position: N/A
Donald W. Pendergast, Jr.
Freelance financial markets writer and online publisher of the Trendzetterz.com S&P 500 Weekly Forecast service.
PRINT THIS ARTICLE
KELTNER CHANNELS
Diamond Offshore Drilling: Setting Up For Reversal?
02/19/14 04:34:15 PMby Donald W. Pendergast, Jr.
Shares of Diamond Offshore Drilling are off by more than 30% since July 2013 but have begun to bounce from major support.
Position: N/A
| As the old saying goes, it's always darkest just before the dawn; for traders in shares of Diamond Offshore Drilling (DO) the point of maximum pitch black may already have been reached — for the time being anyway — as the stock is now manifesting numerous technical signals that suggest that buyers will soon move in to trigger a relief rally that could allow enterprising bulls to capture some decent near term gains. Here's a closer look now. |
|
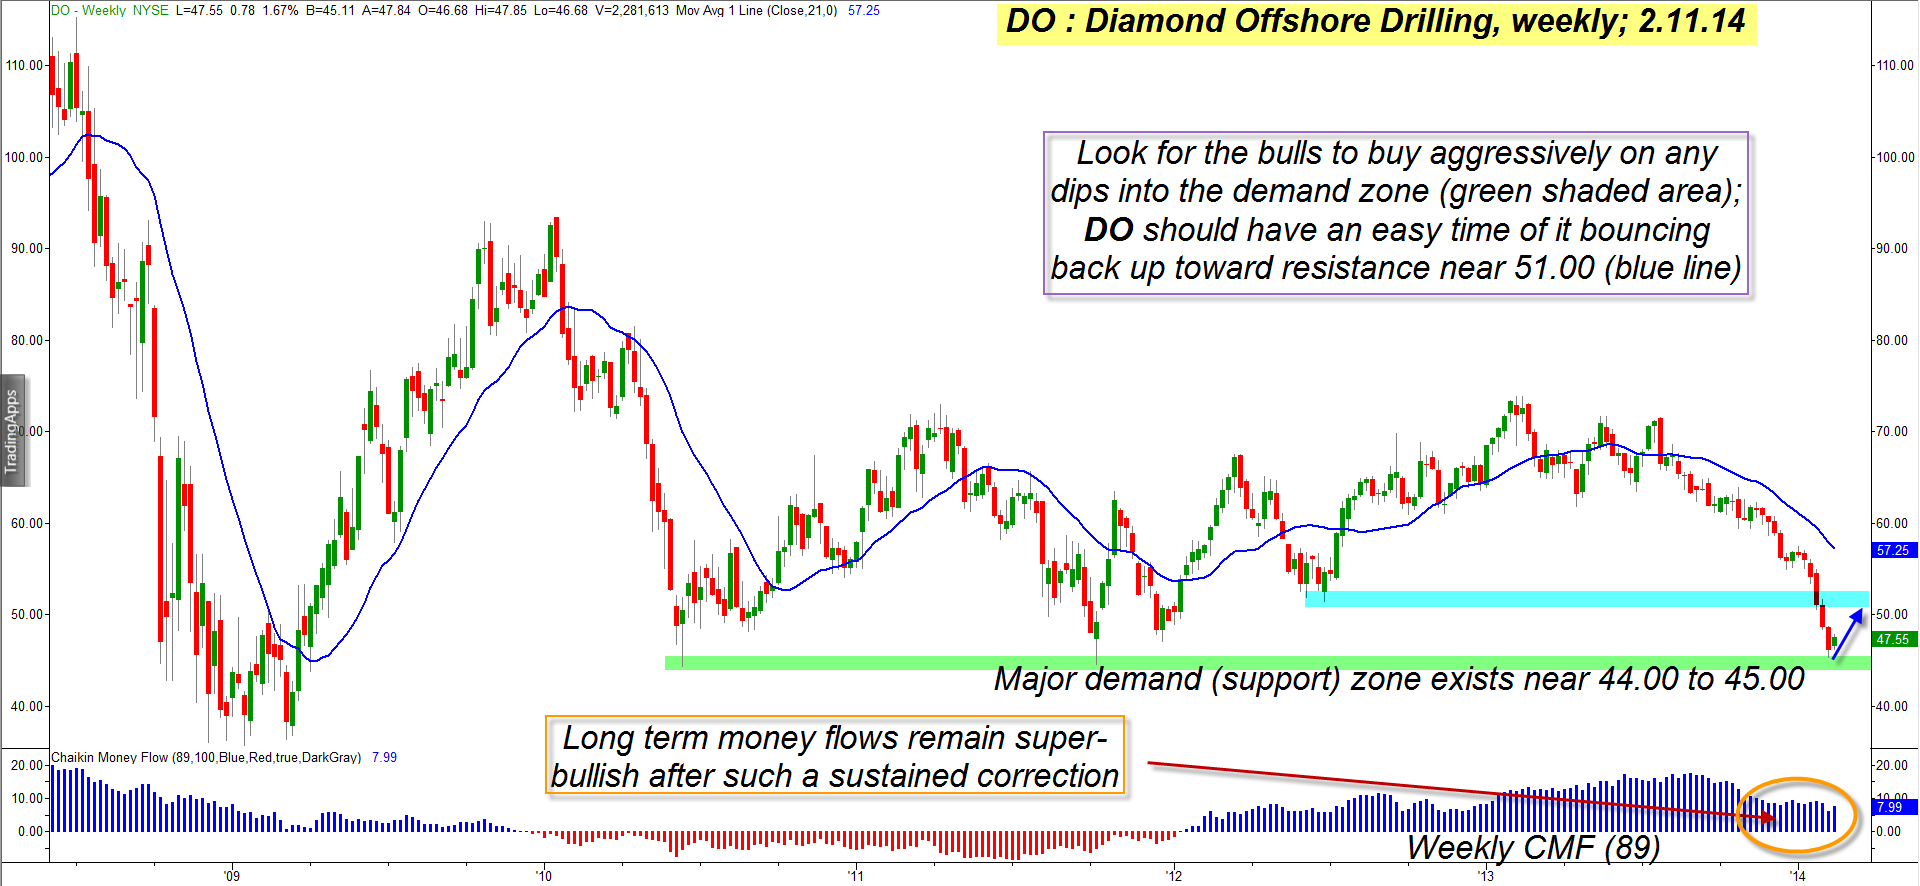
| Figure 1. Diamond Offshore Drilling (DO): Trend following gains can easily evaporate when traders fail to protect/take profits near major support/resistance zones. The 44.00 to 45.00 support level on DO's weekly chart appears to be a prime potential reversal zone. |
| Graphic provided by: TradeStation. |
| |
| Starting with the weekly chart for DO in Figure 1, the first thing that should catch every trader's attention is the major support (demand) zone that exists between 44.00 and 45.00 (green shaded area); after such a steady decline over the past 7 1/2 months, this support level looks to be a major roadblock against further plunges, at least on this particular swing. Failure to be aware of major S/R areas was always a major cause of disappointment in many of my adventures in trend following trades; I would have a great open profit vanish as a stock suddenly hit one of these key price zones, time after time. Once I wised up to the importance of always knowing my S/R levels, my trend and swing trading outcomes became much more profitable. In the case of DO, anyone who is now short this stock should be running a closer trailing stop or even scaling out/covering to avoid getting whacked in a short covering rally from such a massive demand area. Long-term money flow is now indicating accumulation by the smart money, and this is another clue that DO will bounce toward at least 50.00. Should this current bounce gain traction over the next few weeks, the next logical resistance zone exists near the 50.00 to 51.00 area. |
|
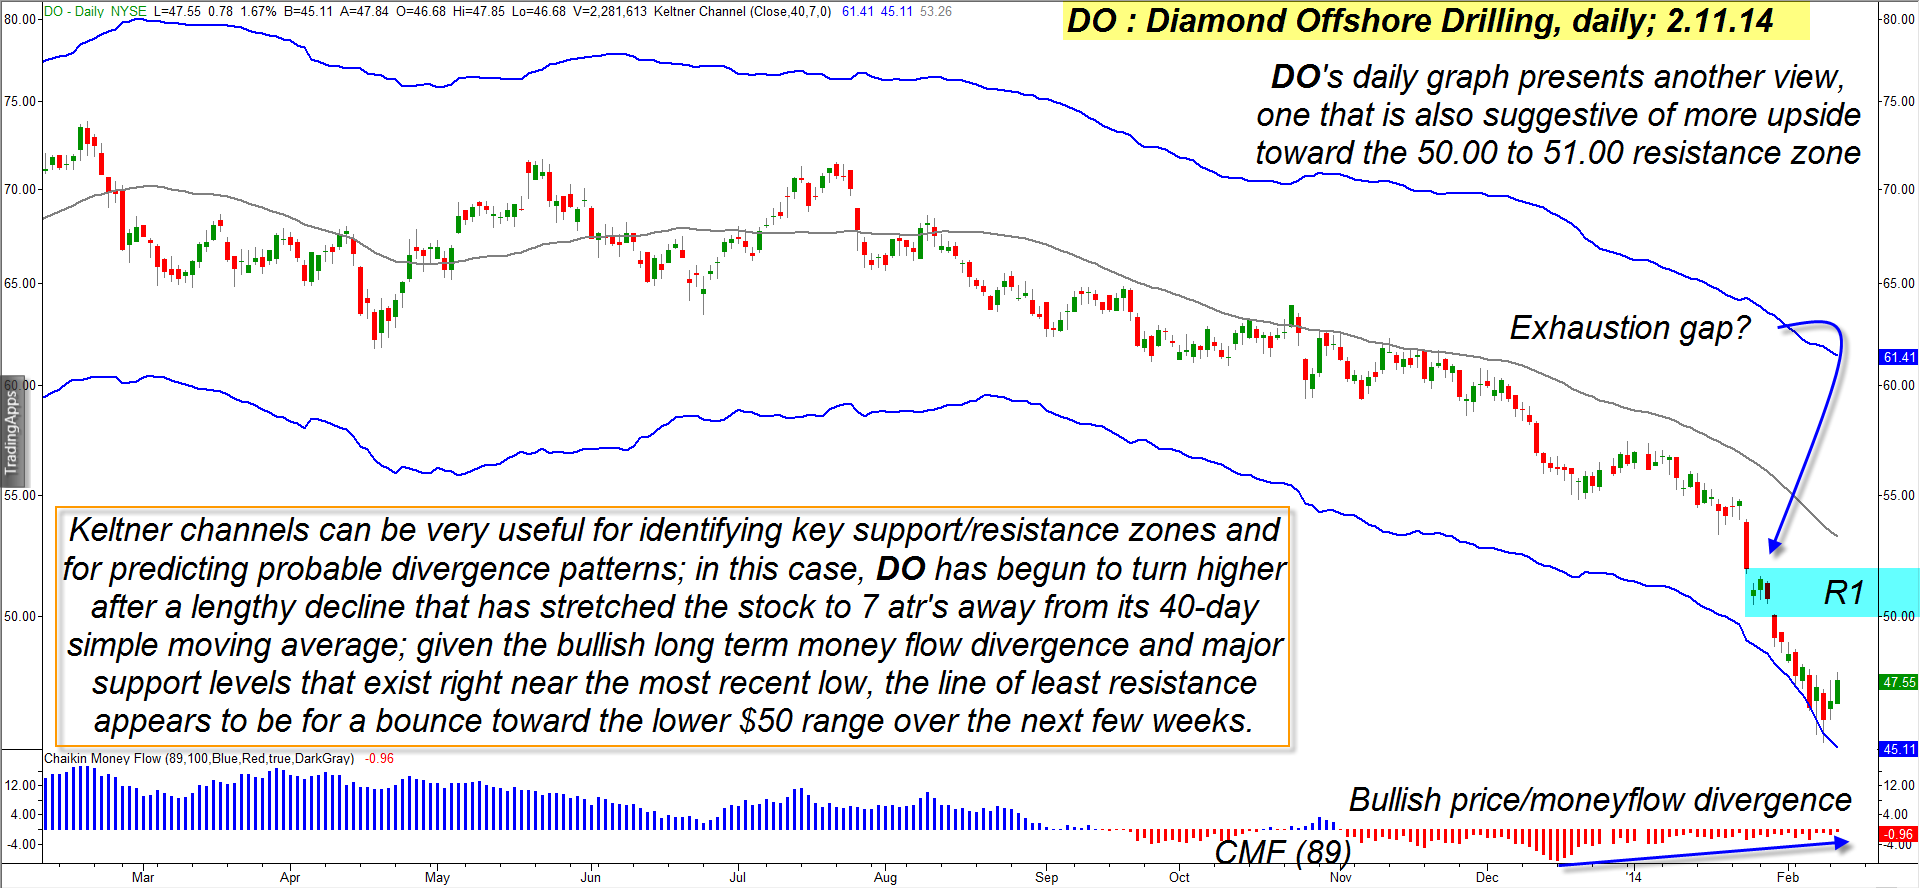
| Figure 2. DO's daily chart shows a major bullish price/money flow divergence, even as the stock has stretched to 7ATRs away from its 40-day average. |
| Graphic provided by: TradeStation. |
| |
| On DO's daily chart in Figure 2 there is also some good news for the bulls; the multimonth selloff managed to overextend the stock to seven average true ranges (ATRs) away from its 40-day simple moving average (SMA). Anytime you see a stock/forex/futures market hit a Keltner band that is seven or eight ATRs away from a 40-period average, you can be sure that you're going to see a reversal in the not-too-distant future, and that may already be proving out here with DO. As with the weekly chart, the daily chart also confirms a solid bullish money flow divergence with price, indicating that the smart money clan (institutional traders) have been starting to buy more of the stock as it plummeted toward such an extreme oversold state. Also note that the final set of bearish gaps before the drop to the Keltner band may qualify as exhaustion gaps. These gaps will be the first major resistance areas DO will face should it manage to bounce toward the 50.00 to 51.00 zone. Even though the technicals strongly suggest that DO will bounce over the next few weeks, please be aware that anything can happen in the stock market; if you see 44.00 taken out to the downside on big volume, that will mean that DO likely has a bit more downside to cover before the value players step in to buy with both hands. The next lower support level is near 37.00, FYI. |
| To play a DO bounce here, consider selling the March '14 $44.25 DO put option; the put has a decent bid/ask spread, only six weeks of remaining time value (rapid time decay) and has an open interest of 265 contracts. Keep your account risk at 1% maximum and use the 44.00 area as your stop loss guide. On any quick run-up toward 50.00, cover the put, take the profit and wait for your next attractive trade setup. Trade wisely until we meet here again. |
Freelance financial markets writer and online publisher of the Trendzetterz.com S&P 500 Weekly Forecast service.
| Title: | Market consultant and writer |
| Company: | Trendzetterz |
| Address: | 81 Hickory Hollow Drive |
| Crossville, TN 38555 | |
| Phone # for sales: | 904-303-4814 |
| Website: | trendzetterz.com |
| E-mail address: | support@trendzetterz.com |
Traders' Resource Links | |
| Trendzetterz has not added any product or service information to TRADERS' RESOURCE. | |
Click here for more information about our publications!
PRINT THIS ARTICLE

Request Information From Our Sponsors
- StockCharts.com, Inc.
- Candle Patterns
- Candlestick Charting Explained
- Intermarket Technical Analysis
- John Murphy on Chart Analysis
- John Murphy's Chart Pattern Recognition
- John Murphy's Market Message
- MurphyExplainsMarketAnalysis-Intermarket Analysis
- MurphyExplainsMarketAnalysis-Visual Analysis
- StockCharts.com
- Technical Analysis of the Financial Markets
- The Visual Investor
- VectorVest, Inc.
- Executive Premier Workshop
- One-Day Options Course
- OptionsPro
- Retirement Income Workshop
- Sure-Fire Trading Systems (VectorVest, Inc.)
- Trading as a Business Workshop
- VectorVest 7 EOD
- VectorVest 7 RealTime/IntraDay
- VectorVest AutoTester
- VectorVest Educational Services
- VectorVest OnLine
- VectorVest Options Analyzer
- VectorVest ProGraphics v6.0
- VectorVest ProTrader 7
- VectorVest RealTime Derby Tool
- VectorVest Simulator
- VectorVest Variator
- VectorVest Watchdog