

HOT TOPICS LIST
- MACD
- Fibonacci
- RSI
- Gann
- ADXR
- Stochastics
- Volume
- Triangles
- Futures
- Cycles
- Volatility
- ZIGZAG
- MESA
- Retracement
- Aroon
INDICATORS LIST
LIST OF TOPICS
PRINT THIS ARTICLE
by Chaitali Mohile
Micron Technology has surged with uniform pace. A fresh bullish breakout is likely to add confidence.
Position: Hold
Chaitali Mohile
Active trader in the Indian stock markets since 2003 and a full-time writer. Trading is largely based upon technical analysis.
PRINT THIS ARTICLE
BREAKOUTS
MU - A Steady Stable Stock
02/19/14 04:27:17 PMby Chaitali Mohile
Micron Technology has surged with uniform pace. A fresh bullish breakout is likely to add confidence.
Position: Hold
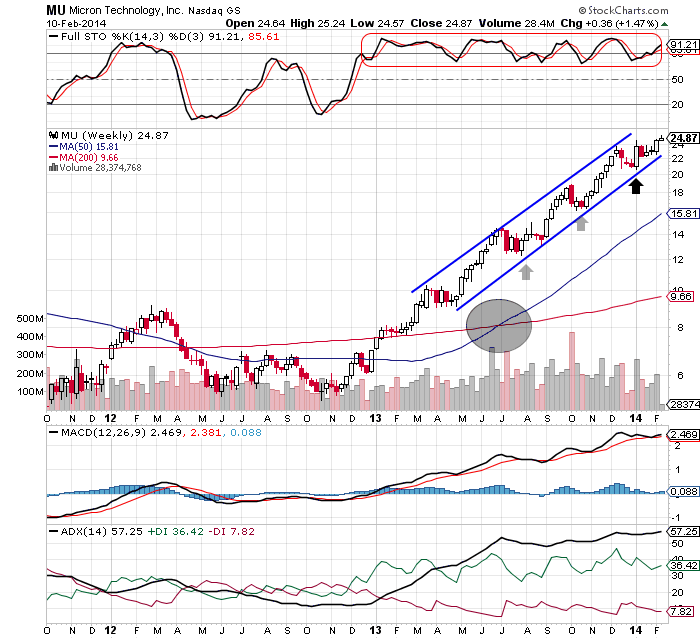
| The year 2012 proved to be a bearish year for Micron Technology (MU) as it remained under its 200-day moving average (MA) resistance. The stock's attempts to breach the resistance failed. Finally in early 2013, the stock underwent a bullish breakout. A weak downtrend reversed to a developing uptrend. Later, a bullish MA crossover induced fresh buying pressure. The average directional index (ADX)(14) also surged to a well developed uptrend area. |
| These two bullish breakouts in Figure 1 developed a sense of stability among traders and investors. An overbought full stochastic (14,3,3) and the positive moving average convergence/divergence (MACD)(12,26,9) helped MU hit new highs. The bullish rally eventually formed the ascending channel shown in Figure 1. All three indicators moved steadily within bullish territories. As a result, the stock respected the lower and upper trendline support/resistance of the ascending channel. The rally marginally consolidated within the channel wherever necessary with the support of the lower trendline. |
|
| FIGURE 1: MU, WEEKLY. |
| Graphic provided by: StockCharts.com. |
| |
| Gradually, the bullish rally reached a new high at the $24 levels. In the meantime, the ADX(14), stochastic oscillator, and MACD(12,26,9) hit their extreme bullish conditions, indicating a trend reversal possibility. But the price rally within the channel shows no signs of a top formation. In fact, the rally is moving with constant strength. Hence, traders with long positions can hold their trade till MU sustains above the lower trendline support. They should also watch for the reversal indication shown by an overheated uptrend, an extremely positive MACD, and the highly overbought full stochastic(14,3,3). |
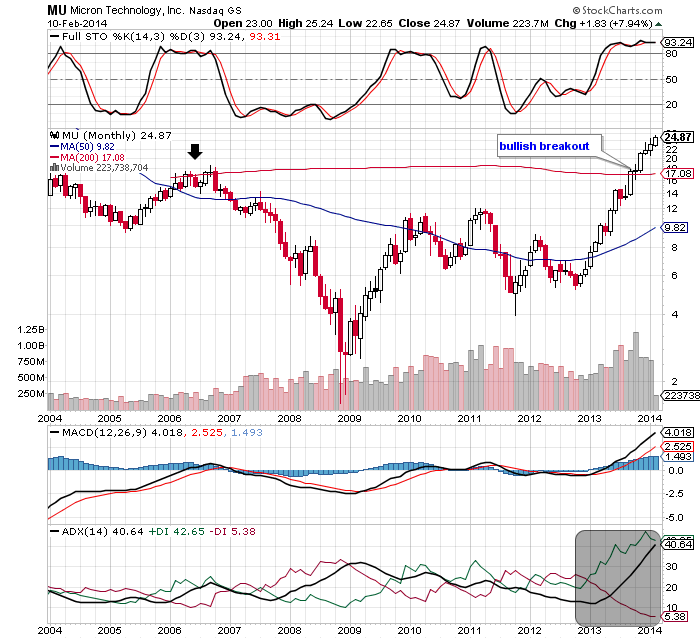
| The monthly time frame chart of MU in Figure 2 shows a historical bullish breakout in 2013. The stock was in a long-term downtrend for several years. Since the stochastic oscillator was juggling between the 20 and 80 levels, the price rally could not surge to a bullish area above the 200-day MA resistance. A pull back rally that began in 2009 struggled to establish support at the 50-day MA for three years. Eventually, the volatile price rally sustained the technical support and initiated a fresh bullish rally. This strong rally opened a low-risk buying opportunity for traders after a very long period. |
|
| FIGURE 2: MU, MONTHLY. |
| Graphic provided by: StockCharts.com. |
| |
| The stock witnessed a huge inflow of the buying pressure, dragging the stock higher and higher. MU entered a robust uptrend and the full stochastic(14,3,3) sustained in the overbought area. These bullish signals helped the stock to convert the 200-day MA resistance to support. Thereafter, the rally gained tremendous bullish confidence to continue its journey with its baby steps. With the ADX(14), stochastic oscillator and MACD(12,26,9) reflecting extremely bullish conditions, the price rally is showing bullish strength. The trend reversal possibility cannot damage the bullish rally as the stock is following its 200-day MA support. To conclude, MU is a strong, steady, and stable stock to be considered for trading in current volatile market conditions. |
Active trader in the Indian stock markets since 2003 and a full-time writer. Trading is largely based upon technical analysis.
| Company: | Independent |
| Address: | C1/3 Parth Indraprasth Towers. Vastrapur |
| Ahmedabad, Guj 380015 | |
| E-mail address: | chaitalimohile@yahoo.co.in |
Traders' Resource Links | |
| Independent has not added any product or service information to TRADERS' RESOURCE. | |
Click here for more information about our publications!
Comments
Date:�02/20/14Rank:�4Comment:�good stuff, thank you

Request Information From Our Sponsors
- StockCharts.com, Inc.
- Candle Patterns
- Candlestick Charting Explained
- Intermarket Technical Analysis
- John Murphy on Chart Analysis
- John Murphy's Chart Pattern Recognition
- John Murphy's Market Message
- MurphyExplainsMarketAnalysis-Intermarket Analysis
- MurphyExplainsMarketAnalysis-Visual Analysis
- StockCharts.com
- Technical Analysis of the Financial Markets
- The Visual Investor
- VectorVest, Inc.
- Executive Premier Workshop
- One-Day Options Course
- OptionsPro
- Retirement Income Workshop
- Sure-Fire Trading Systems (VectorVest, Inc.)
- Trading as a Business Workshop
- VectorVest 7 EOD
- VectorVest 7 RealTime/IntraDay
- VectorVest AutoTester
- VectorVest Educational Services
- VectorVest OnLine
- VectorVest Options Analyzer
- VectorVest ProGraphics v6.0
- VectorVest ProTrader 7
- VectorVest RealTime Derby Tool
- VectorVest Simulator
- VectorVest Variator
- VectorVest Watchdog