

HOT TOPICS LIST
- MACD
- Fibonacci
- RSI
- Gann
- ADXR
- Stochastics
- Volume
- Triangles
- Futures
- Cycles
- Volatility
- ZIGZAG
- MESA
- Retracement
- Aroon
INDICATORS LIST
LIST OF TOPICS
PRINT THIS ARTICLE
by Donald W. Pendergast, Jr.
Shares of Alexion Pharmaceuticals recently gapped sharply higher -- right into a key resistance zone.
Position: N/A
Donald W. Pendergast, Jr.
Freelance financial markets writer and online publisher of the Trendzetterz.com S&P 500 Weekly Forecast service.
PRINT THIS ARTICLE
KELTNER CHANNELS
ALXN: Getting Overextended On The Upside?
02/18/14 04:11:08 PMby Donald W. Pendergast, Jr.
Shares of Alexion Pharmaceuticals recently gapped sharply higher -- right into a key resistance zone.
Position: N/A
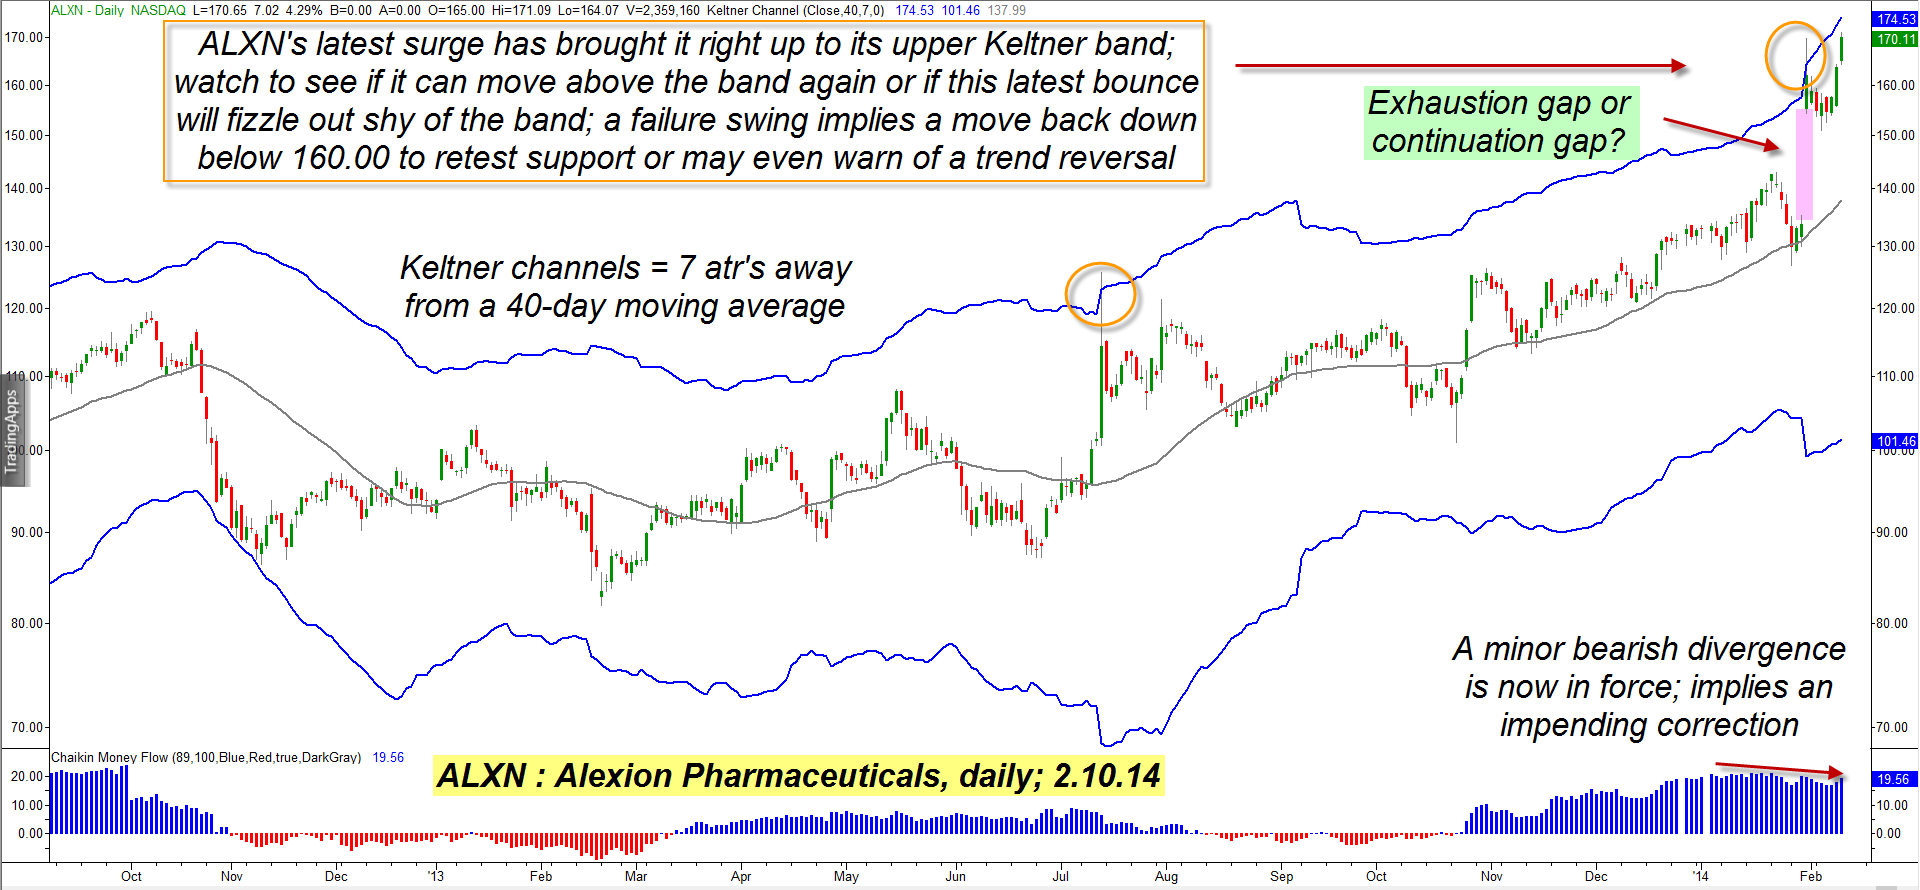
| Pharma/biotech-related stocks are noted for extreme volatility, especially around earning release dates or FDA decisions regarding approval/disapproval of their latest products; shares of Alexion Pharmaceuticals (ALXN) are also noted for sharp swings, strong trends, and on occasion, truly chaotic, choppy price action. The stock just gapped higher — a large bullish gap at that mdash; and the question for traders is whether this is a continuation gap or an exhaustion gap, the kind that typically precede a significant trend reversal. Here's a closer look, using ALXN's daily chart (Figure 1). |
|
| Figure 1. Alexion Pharmaceuticals (ALXN): A failure of the latest upswing to close above the upper Keltner band will imply that a substantial correction is likely. However, a continued surge back above the upper band implies that a high-degree price cycle is intent on driving the stock significantly higher. |
| Graphic provided by: TradeStation. |
| |
| ALXN's daily chart features only two technical indicators: 1. A Keltner channel set to seven ATRs (average true ranges) away from a 40-day simple moving average (SMA). 2. An 89-day Chaikin Money flow histogram (CMF)(89). This simple technical template can be put to good use by discretionary and system traders who desire an extra degree of confirmation before committing to a new trade. For example, consider the implications of what you now see on the chart: A. The long-term money flow histogram is diverging in a bearish way from the price action on the chart, on a near term and longer term basis. B. The stock has gapped higher into its upper Keltner band; if this is an exhaustion gap, then this becomes doubly significant to short-term swing traders. Although this may seem like no big, earth-shaking revelation, traders who are aware of these three dynamics (possible exhaustion gap after a long rally, heavy Keltner resistance, and negative money flow divergence) may be inclined to be more conservative in the amount of capital they commit to new ALXN long positions at this time. Or they might even decide to stand aside and wait until the technical picture becomes clearer before deciding to take a new position. ALXN's recent price action has been plenty chaotic, meaning that the use of Fibonacci ABC swing price targets is of limited value here; waiting to see if the stock can soon burst again above its upper band — or fail, setting up a correction — is the wisest strategy for traders in this stock right now. |
|
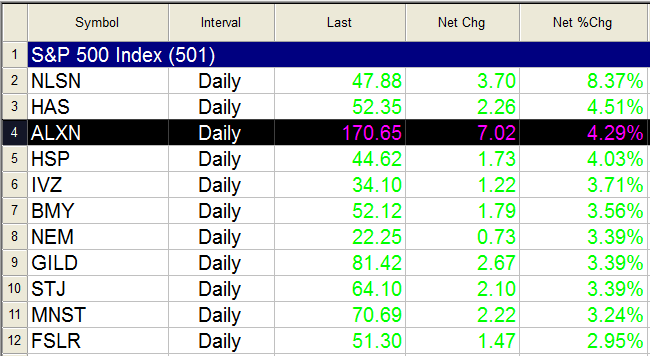
| Figure 2. ALXN enjoyed solid daily gains on February 10, 2014, as did a number of other key S&P 500 index (.SPX) component issues. |
| Graphic provided by: TradeStation. |
| Graphic provided by: TradeStation RadarScreen. |
| |
| Playing ALXN in the days/weeks ahead might look something like this: 1. If the stock continues to surge, blasting above the upper band soon, consider putting on a near-term covered call trade, as this may imply that a higher-degree price cycle is exerting significant upward momentum on the stock, the kind that makes covered call traders happy — and profitable. 2. If ALXN stalls out before hitting the upper band on this latest upswing, you will have an excellent short selling opportunity, as this will confirm that the latest gap is of the exhaustion rather than the continuation variety. Look for a fast move back toward at least 160.00, if not lower, as latecomers quickly sell out as the "smart money" pulls the rug out as they go short once again. Either way this plays out, be sure to keep your account risk small (1% max) and to watch your positions (especially short positions) very closely. Trade wisely until we meet here again. |
Freelance financial markets writer and online publisher of the Trendzetterz.com S&P 500 Weekly Forecast service.
| Title: | Market consultant and writer |
| Company: | Trendzetterz |
| Address: | 81 Hickory Hollow Drive |
| Crossville, TN 38555 | |
| Phone # for sales: | 904-303-4814 |
| Website: | trendzetterz.com |
| E-mail address: | support@trendzetterz.com |
Traders' Resource Links | |
| Trendzetterz has not added any product or service information to TRADERS' RESOURCE. | |
Click here for more information about our publications!
Comments

Request Information From Our Sponsors
- StockCharts.com, Inc.
- Candle Patterns
- Candlestick Charting Explained
- Intermarket Technical Analysis
- John Murphy on Chart Analysis
- John Murphy's Chart Pattern Recognition
- John Murphy's Market Message
- MurphyExplainsMarketAnalysis-Intermarket Analysis
- MurphyExplainsMarketAnalysis-Visual Analysis
- StockCharts.com
- Technical Analysis of the Financial Markets
- The Visual Investor
- VectorVest, Inc.
- Executive Premier Workshop
- One-Day Options Course
- OptionsPro
- Retirement Income Workshop
- Sure-Fire Trading Systems (VectorVest, Inc.)
- Trading as a Business Workshop
- VectorVest 7 EOD
- VectorVest 7 RealTime/IntraDay
- VectorVest AutoTester
- VectorVest Educational Services
- VectorVest OnLine
- VectorVest Options Analyzer
- VectorVest ProGraphics v6.0
- VectorVest ProTrader 7
- VectorVest RealTime Derby Tool
- VectorVest Simulator
- VectorVest Variator
- VectorVest Watchdog